The New Zealand dollar could not reach new multi year highs once again, but eventually edged lower. Is it a temporary correction or a change of course? The highlights of the upcoming week are two business surveys in New Zealand. Here is an analysis of fundamentals and an updated technical analysis for NZD/USD.
The ANZ Business Confidence indicator which reached sky high levels in February, continued falling back to reality with a slide to 42.8 in June, yet this still reflects optimism. In the US, job growth continues at full speed, with Non-Farm Payrolls at 288K. This helped the greenback only against some currencies, with the kiwi excluded.
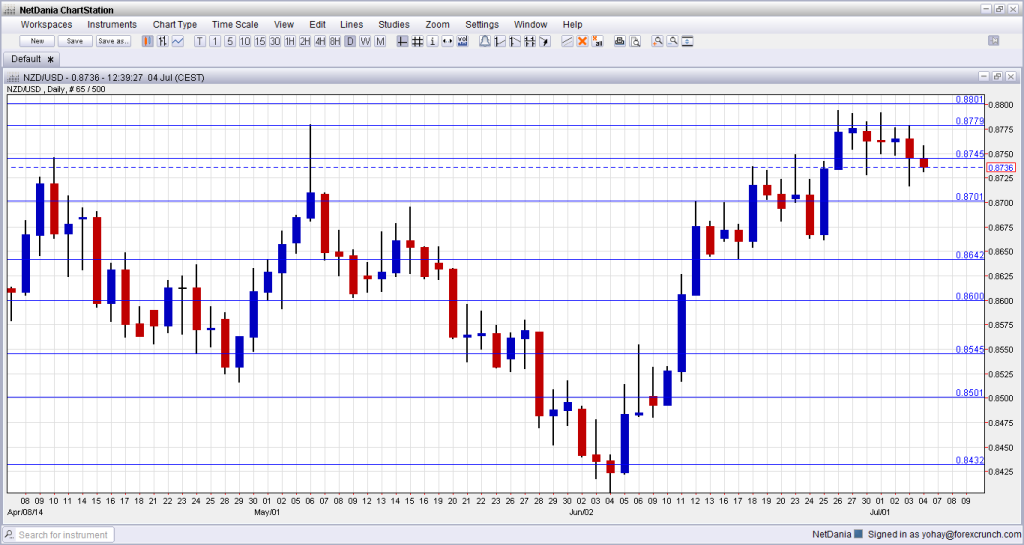
[do action=”autoupdate” tag=”NZDUSDUpdate”/]NZD/USD daily chart with support and resistance lines on it. Click to enlarge:
- REINZ HPI: Exact publication time unknown at the time of writing. This house price indicator surprised in May with a drop of 1.2%, cutting short 3 months of gains. A return to a modest gain is likely now in this indicator.
- NZIER Business Confidence: Monday, 22:00. This survey of 2500 business made by the New Zealand Institute of Economic Research usually has a significant impact on the kiwi, especially as it is released only once per quarter. After a nice and gradual rise in the past two years, the indicator stalled at high ground of 52 points in Q1 2014. A small drop is probable now. It’s important to note that every figure above 0 means economic optimism.
- Business NZ Manufacturing Index: Wednesday, 22:30. This PMI-like indicator has been positive for a long time, but it has shown slower growth in the past two months. After a drop to 52.7 points in May, a small uptick is likely in June.
- FPI: Thursday, 22:45. As New Zealand relies on food exports (especially milk), the Food Price Index is significant. Two consecutive rises in April and Map will likely be followed with a slide in prices now, given the disappointing milk auction.
* All times are GMT.
NZD/USD Technical Analysis
Kiwi/dollar began the week with another attempt to move higher, but the move above 0.8780 (mentioned last week) failed again.
Live chart of NZD/USD: [do action=”tradingviews” pair=”NZDUSD” interval=”60″/]
Technical lines, from top to bottom:
We start from the highest level in decades: 0.8840. This is the ultimate line of resistance. Above this point, only the round level of 0.90 awaits.
The May peak of 0.8780 is a very important line: the kiwi hesitated towards this line in June. The previous 2014 peak of 0.8745 is now weaker resistance after being broken.
The round number of 0.87 proved its strength during May and joins the chart as key upside resistance. The older swing high of 0.8640 worked as a pivotal line but eventually capped the pair.
It is followed by the round number of 0.86, which worked as a cushion during May 2014. The low of 0.8550 served as yet another pivotal line in the range.
0.85 is an important and very round number that looks like a clear separator of ranges. 0.8435 was the peak in September and was retested in January. It was a strong double top.
I turn from neutral to bearish on NZD/USD
The central bank in New Zealand wants a weaker kiwi and perhaps now it has its chance: the kiwi is slightly weaker after the strong NFP in the US. We have seen in Australia how the central bank hit the Aussie just as it was beginning to fall and sent it tumbling down. This might happen in New Zealand as well.
More kiwi: Double Bottom Suggests More Gains For AUDNZD
Further reading:
- For a broad view of all the week’s major events worldwide, read the USD outlook.
- For EUR/USD, check out the Euro to Dollar forecast.
- For the Japanese yen, read the USD/JPY forecast.
- For GBP/USD (cable), look into the British Pound forecast.
- For the Australian dollar (Aussie), check out the AUD to USD forecast.
- For USD/CAD (loonie), check out the Canadian dollar forecast.
