The Japanese yen showed some strength last week, as USD/JPY touched 5-week lows. The pair closed at 106.87, but did manage to come close to the 105 line during the week. The upcoming week has just three events. Here is an outlook on the major events moving the yen and an updated technical analysis for USD/JPY.
The US dollar shrugged off weakness in US retail sales and a poor PPI reading. US employment numbers continue to looks strong,with the best jobless claims in over a decade. In Japan, it was a light week with no major releases.
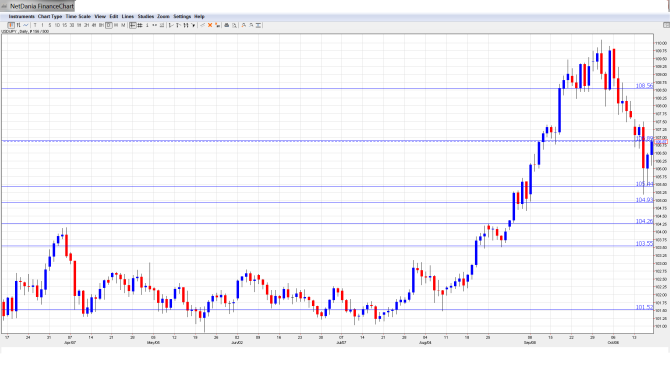
[do action=”autoupdate” tag=”USDJPYUpdate”/]USD/JPY graph with support and resistance lines on it:
- All Industries Activity: Tuesday, 4:30. This indicator looks at the total value of goods and services purchased by businesses. The indicator posted a decline of -0.2% in September, its third decline in four releases. This was well off the estimate of +0.4%. Another decline is expected in the upcoming release, with the estimate standing at -0.3%.
- Trade Balance: Tuesday, 23:50. Trade Balance is the highlight of the week. It is closely linked to currency demand, as foreigners need to purchase yen to pay for Japanese exports. The trade deficit continues to narrow, with the previous release dropping to -0.92 trillion yen. This beat the estimate of -0.99 trillion. Little change is expected in the upcoming release, with an estimate of -0.91 trillion.
- Flash Manufacturing PMI: Thursday, 1:35. Manufacturing PMI weakened to 51.7 points last month, but remains above the 50-point level, which indicates expansion in the manufacturing sector. The forecast for the upcoming release stands at 52.1 points.
* All times are GMT
USD/JPY Technical Analysis
Dollar/yen started the week at 107.33. The pair quickly touched a high of 107.57 and then dropped sharply, reaching a low of 105.18, as support remained intact at 104.92 (discussed last week). USD/JPY closed the week at 106.87.
Live chart of USD/JPY: [do action=”tradingviews” pair=”USDJPY” interval=”60″/]
Technical lines from top to bottom:
112.48 marked the start of a yen rally in January 2008, which saw USD/JPY drop below the 100 level.
110.68 represented a high point of a strong dollar rally in August 2008, which started around the key 100 level.
108.58 continues in a resistance role.
106.88 has provided support since mid-September. The pair closed the week just below this line, which could see action early in the week.
105.44 had held firm since December.
104.92 capped the pair around the turn of the year.
104.25 was an important resistance line back in August.
103.55 marked the low point of the recent dollar rally, which saw USD/JPY push above the 110 line in the first week of October.
101.52 is the final support line for now. It was last tested in April.
I am neutral on USD/JPY
Despite solid US numbers, led by job data, the yen continues to make inroads against the greenback. With only a few Japanese events on this week’s schedule, key US data could have a significant impact on the pair’s movement.
In our latest podcast, talk about: Questions for every trader, crashing oil, state of the UK and global gloom.
Subscribe to our podcast on iTunes.
Further reading:
- For a broad view of all the week’s major events worldwide, read the USD outlook.
- For EUR/USD, check out the Euro to Dollar forecast.
- For GBP/USD (cable), look into the British Pound forecast.
- For the Australian dollar (Aussie), check out the AUD to USD forecast.
- For USD/CAD (loonie), check out the Canadian dollar forecast.
- For the kiwi, see the NZDUSD forecast.
