The New Zealand dollar was struggling with its peer commodity currencies, but eventually enjoyed the sell off of the USD. What’s next for the kiwi? Retail sales number are the highlights. Here is an analysis of fundamentals and an updated technical analysis for NZD/USD.
The REINZ HPI dropped by 1% for a second month in a row. It seems that the RBNZ’s macro prudential tools are bearing fruit. The greenback was hit by weak retail sales, and also falling consumer confidence.
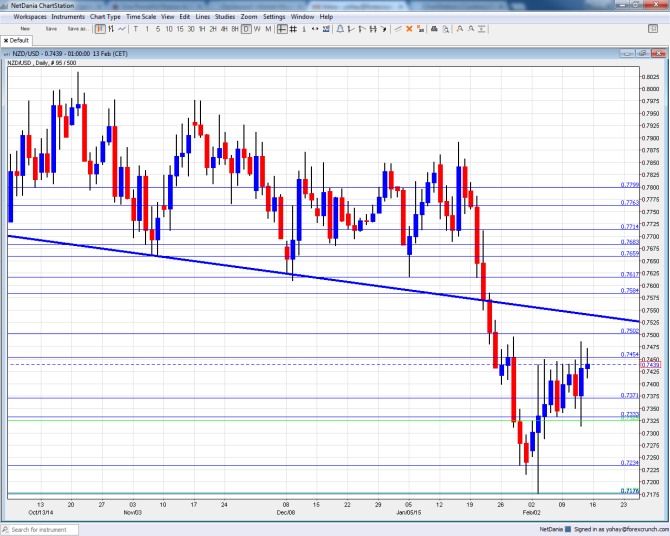
[do action=”autoupdate” tag=”NZDUSDUpdate”/]NZD/USD daily chart with support and resistance lines on it. Click to enlarge:
- Retail Sales: Sunday, 21:45. Very early in the trading week, New Zealand releases these all important numbers: they are published only once per quarter, thus garnering more attention than parallel publications in other countries. In Q3, the country enjoyed a gain of 1.5% in headline sales and 1.4% in core sales. Slightly slower numbers are on the cards now: a gain of 1.3% in retail sales and 1.1% in core sales.
- GDT Price Index: Tuesday. The Global Dairy Trade Price Index has become the quickest gauge for New Zealand’s economy, via a snapshot of its main exports. The bi weekly indicator enjoyed 4 consecutive weeks of rises, including a leap of 9.4% last time. A dip could be seen now.
- PPI: Wednesday, 21:45. Also here, producer prices are released only once per quarter, giving them extra importance. These fell 1.5% in Q3 in the more important PPI Input number. Another drop is likely now in the number for Q4: -0.2%. PPI Output slipped by 1.1% and is now likely to fall 0.3%.
* All times are GMT.
NZD/USD Technical Analysis
Kiwi/dollar began the week with an upwards move, but basically remained in range.
Live chart of NZD/USD:
[do action=”tradingviews” pair=”NZDUSD” interval=”60″/]Technical lines, from top to bottom:
0.7715 was stronger support after serving holding the pair in December. 0.7680 worked as support in December and that is where the pair stopped in early January 2015.
Below this point, we are back to levels last seen in 2012: 0.7615 now works as resistance after providing support during January 2015. It is followed closely by 0.7585 which capped the pair on an initial recovery attempt.
The very round number of 0.75 capped the pair just before the big fall and serves as strong resistance. It is followed by 0.7450 that had a role in the past.
The next line is 0.7370, which was a low point in 2011. It is followed by 0.7325, which capped the pair in the middle of 2010.
The recent 2015 low of 0.7235 is now the next support line. It is followed by 0.7180 that served as resistance back in 2010.
The swing low of 0.71 in 2011 provides further support before the very round number of 0.70.
Below this round number, we have 0.6950 and 0.6810.
I turn from neutral to bullish on NZD/USD
With some kind of stabilization in the greenback’s rise, the kiwi could shine: strong employment numbers and rising dairy prices might be accompanied now by a strong retail sales figure. And while the USD remains strong, it has other currencies to ride on.
In our latest podcast we feature an interview with Dan Blystone and update on Greece
Further reading:
- For a broad view of all the week’s major events worldwide, read the USD outlook.
- For EUR/USD, check out the Euro to Dollar forecast.
- For the Japanese yen, read the USD/JPY forecast.
- For GBP/USD (cable), look into the British Pound forecast.
- For the Australian dollar (Aussie), check out the AUD to USD forecast.
- For USD/CAD (loonie), check out the Canadian dollar forecast.
