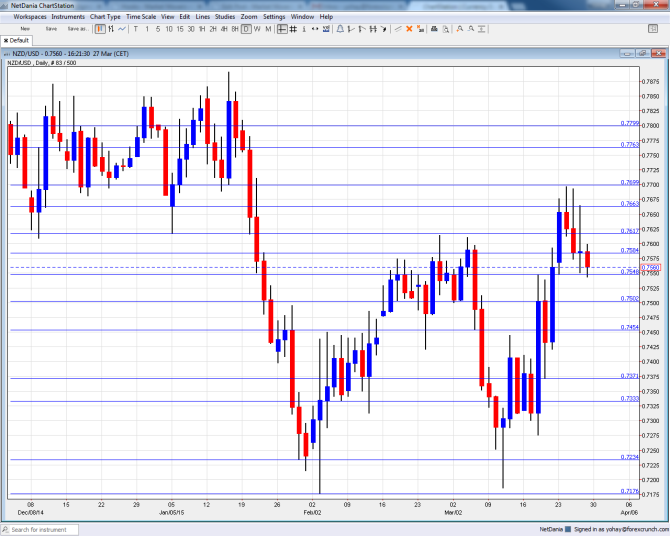
The New Zealand dollar managed to reach new highs against the greenback, but it found it hard to maintain these achievements and ended the week full circle. Business confidence and milk prices are the highlights. Here is an analysis of fundamentals and an updated technical analysis for NZD/USD.
In the US, inflation came out stronger than expected and so did new home sales. This, together with other positive developments, allowed the greenback for a comeback. In New Zealand, we had another month of a positive trade trade balance, but it came in below expectations.
[do action=”autoupdate” tag=”NZDUSDUpdate”/]NZD/USD daily chart with support and resistance lines on it. Click to enlarge:
- Building Consents: Monday, 21:45. This monthly release of building permits provides a good look at the housing sector, which has been somewhat cooling down lately. After two consecutive falls, including a drop of 3.8% in January, a small rise could be seen now.
- ANZ Business Confidence: Tuesday, 00:00. This important survey of 1500 businesses has advanced to 34.4 points in February, continuing the recovery after the slide in 2014. Another small rise is on the cards now.
- GDT Price Index: Wednesday. This bi-weekly figure provides a snapshot view on New Zealand’s primary export: dairy prices. After 6 straight auctions of rises, the previous release saw a drop of 8.8%. A bounce back is likely now.
- ANZ Commodity Prices: Thursday, 00:00. The figure from ANZ gives another look at commodity prices which are critical to the country. However, this time the publication is somewhat overshadowed by the GDT figure.
* All times are GMT.
NZD/USD Technical Analysis
Kiwi/dollar began the week rising above the 0.7585 line (mentioned last week) and continued higher.
Live chart of NZD/USD:
[do action=”tradingviews” pair=”NZDUSD” interval=”60″/]Technical lines, from top to bottom:
The round level of 0.78 played a role in the past and is high resistance. IT is followed closely by 0.7765 which capped the pair late in 2014.
The round level of 0.77 proved its strength in March 2015 and capped the kiwi’s ascent. Below, 0.7665 is lower resistance, after having this role in December.
0.7615 now works as resistance after providing support during January 2015. It is followed closely by 0.7585 which capped the pair on an initial recovery attempt. Another line to watch out for is 0.7550, which separated ranges in March 2015.
The very round number of 0.75 capped the pair just before the big fall and serves as strong resistance. It is followed by 0.7450 that had a role in the past.
The next line is 0.7370, which was a low point in 2011. It is followed by 0.7325, which capped the pair in the middle of 2010.
The recent 2015 low of 0.7235 is now the next support line. It is followed by 0.7180 that served as resistance back in 2010.
The swing low of 0.71 in 2011 provides further support before the very round number of 0.70.
I am bearish on NZD/USD
The kiwi had its nice run, making it all the way to 0.77. At these levels, a combination of RBNZ jawboning combined with some improving US data could extend the pair’s correction.
In our latest podcast we interview David Stein on investment, QE and lots more
Subscribe to Market Movers on iTunes
Further reading:
- For a broad view of all the week’s major events worldwide, read the USD outlook.
- For EUR/USD, check out the Euro to Dollar forecast.
- For the Japanese yen, read the USD/JPY forecast.
- For GBP/USD (cable), look into the British Pound forecast.
- For the Australian dollar (Aussie), check out the AUD to USD forecast.
- For USD/CAD (loonie), check out the Canadian dollar forecast.

