GBP/USD continued its sharp slide last week, losing 200 points. The pair closed at 1.5273. This week’s highlights are the PMI reports. Here is an outlook on the major events moving the pound and an updated technical analysis for GBP/USD.
The dollar was broadly stronger last week, and had no trouble posting strong gains against the British pound. The US currency got a boost from strong core durables data out of the US and managed to weather weak GDP and employment numbers. In the UK, Second Estimate GDP came in at 0.3%, within expectations.
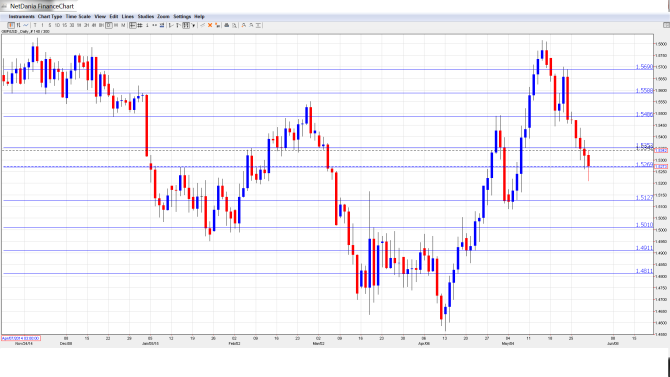
[do action=”autoupdate” tag=”GBPUSDUpdate”/]GBP/USD graph with support and resistance lines on it. Click to enlarge:
- Manufacturing PMI: Monday, 8:30. Manufacturing PMI has remained above the 50-point level in 2015, pointing to ongoing construction. However. the index slipped to 51.9 points in April, well off the estimate of 54.6 points. The markets are expecting better news in the May report, with an estimate of 52.7 points.
- Construction PMI: Tuesday, 8:30. The PMI has lost ground in recent readings, and slipped to 54.2 points in the April release. This was well short of the forecast of 57.6 points. The markets are expecting the index to rebound in the May report, with an estimate of 5.1 points.
- Net Lending to Individuals: Tuesday, 8:30. Consumer credit levels are carefully monitored, as higher borrowing levels usually translate into stronger consumer spending, a key component of economic growth. The indicator has been moving upwards in 2015, and climbed to $3.1 billion pounds in April, beating the estimate of $2.6 billion pounds. The markets are braced for a downturn in the May report, with the estimate standing at 2.3 billion pounds.
- 10-year Bond Auction: Tuesday, Tentative. Ten-year bonds came in at 1.88% at the April auction, up from 1.68% a month earlier.
- BRC Shop Price Index: Tuesday, 23:01. This indicator measures inflation in BRC shops. The indicator continues to post declines, and came in at -1.9% in April. Little change is expected in the upcoming release.
- Nationwide HPI: Wednesday, 6:00. This housing inflation indicator surprised the markets with an excellent gain of 1.0% in April, crushing the estimate of 0.2%. However, the markets are expecting a downturn in the May report, with an estimate of 0.3%. Will the indicator once again beat the prediction?
- Services PMI: Wednesday, 8:30. This week’s PMI parade wraps up with Services PMI. The index improved to 59.5 points in April, beating the estimate of 58.6 points. This marked an 8-month high. Little changed is expected in the May release.
- Official Bank Rate: Thursday, 11:00. The benchmark rate has remained at 0.50% since March 2009, and no change is expected in the June rate.
- Asset Purchase Facility: Thursday, 11:00. The BOE has maintained Asset Purchase Facility at 375 billion pounds since July 2012, and no move is expected in the upcoming announcement.
- Halifax HPI: Friday, 5th-9th. This housing inflation index posted a strong gain of 1.6% in the April reading, well above the forecast of 0.3%. This points to stronger activity in the UK housing sector. However, the markets are bracing for a small gain of just 0.2% in the May release.
- Consumer Inflation Expectations: Friday, 8:30. Analysts rely on this indicator to help predict actual inflation data. The indicator, which is released each quarter, has been softening. In the fourth quarter, the indicator slipped below the key 2% level in April, with a reading of 1.9%. Will the indicator improve in the Q1 report?
* All times are GMT
GBP/USD Technical Analysis
GBP/USD opened the week at 1.5472, and quickly touched a high of 1.5473, as resistance remained firm at 1.5485 (discussed last week). It was all downhill from there for the pair, as the pair slipped to a low of 1.5209. The pair closed the week at 1.5273.
Live chart of GBP/USD: [do action=”tradingviews” pair=”GBPUSD” interval=”60″/]
Technical lines from top to bottom
With the pound posting sharp losses, we begin at lower levels:
1.5690 marked the high point of the current US dollar rally.
1.5590 worked as support late in 2014 and is a pivotal line in the current range.
1.5485 worked as support and later switched to resistance in April. It is closely followed by 1.5425 which had a role in the past.
1.5350 worked as resistance in January and was a stepping stone on the way up later on.
1.5270 capped the pair early in the year.
1.5127 is the next support line.
1.5008 is the last level before the psychologically important 1.50 level.
1.4911 was an important line of support in mid-April.
1.4813 is the final support level for now. This line marked the start of a pound rally in July 2013 that saw GBP/USD climb above 1.61.
I am bearish on GBP/USD.
The US dollar is on an impressive roll against its major rivals, and could continue its upward movement this week. With analysts expecting better news in Q2 after a disappointing Q1, we could see the pair continue its downward move towards the symbolic 1.50 level.
In our latest podcast, we explain the recent USD rally, what’s ahead and lots more
Subscribe to Market Movers on iTunes
Further reading:
- For a broad view of all the week’s major events worldwide, read the USD outlook.
- For EUR/USD, check out the Euro to Dollar forecast.
- For the Japanese yen, read the USD/JPY forecast.
- For the kiwi, see the NZDUSD forecast.
- For the Australian dollar (Aussie), check out the AUD to USD forecast.
- USD/CAD (loonie), check out the Canadian dollar.
