The New Zealand dollar managed to find some ground and showed a stabilization of sorts. The rate decision is the key event. Will the RBNZ cut the rates? Here is an analysis of fundamentals and an updated technical analysis for NZD/USD.
The bi weekly GDT dropped for a sixth consecutive time, this time by 4.3%. This put some weight on the kiwi. However, terms of trade improved. In the US, data was not good enough and this triggered a USD sell-off that stabilized NZD/USD.
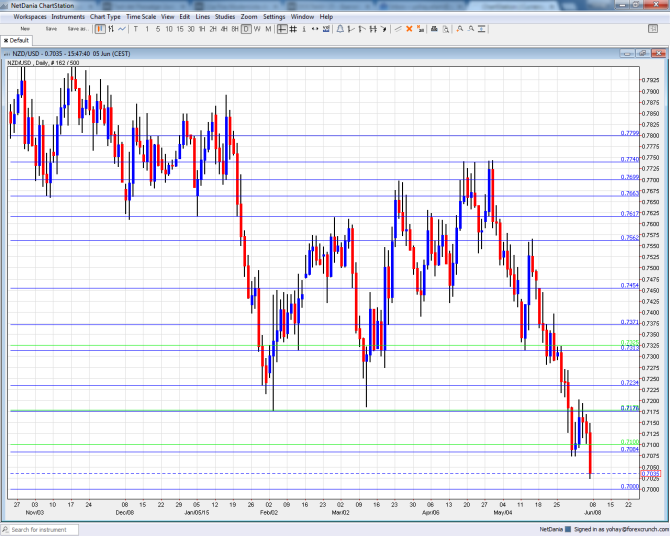
[do action=”autoupdate” tag=”NZDUSDUpdate”/]NZD/USD daily chart with support and resistance lines on it. Click to enlarge:
- Manufacturing Sales: Monday, 22:45. This quarterly release has been negative in the past 3 publication,s with a slide of 0.7% in Q4 2014. The level of sales in the manufacturing sector could advance in Q1 2015.
- Rate decision: Wednesday, 21:00. This is a tough decision for the Reserve Bank of New Zealand. On one hand, it has released hints that a rate cut could come either in June or in July, and there are economic reasons to do so. On the other hand, it has already received part of the impact it wished for: the value of the currency is significantly lower than it was in the previous decision. Even if the Bank does not cut the interest rate, currently at 3.50%, it may switch from a neutral to a dovish bias. It will be important to note the tone of RBNZ Governor Graeme Wheeler n the accompanying press conference.
- Business NZ Manufacturing Index: Thursday, 22:30. This PMIM-like survey dropped to 51.8 points in April, reflecting weak growth in the manufacturing sector. A similar number is on the cards now.
- FPI: Thursday, 22:45. The Food Price Index is important as New Zealand exports food, primarily dairy products. The FPI slid 0.3% in April and has likely ticked up in May.
NZD/USD Technical Analysis
Kiwi/dollar remained depressed in the wake of the new month but managed to hold above the 0.7064 level mentioned last week. From there, it enjoyed a recovery .
Live chart of NZD/USD:
[do action=”tradingviews” pair=”NZDUSD” interval=”60″/]Technical lines, from top to bottom:
We begin from lower ground this time.
0.7615 now works as resistance after providing support during January 2015. 0.7560 capped the pair in May and serves as important resistance.
The very round number of 0.75 capped the pair just before the big fall and serves as strong resistance. It is followed by 0.7450 that had a role in the past.
The next line is 0.7370, which was a low point in 2011. It is followed by 0.7315, which supported the pair in May.
The recent 2015 low of 0.7235 is now the next support line. It is followed by 0.7180 that served as resistance back in 2010.
Lower, the round level of 0.71 used to provide support in the past but was breached now. The new low of 0.7064 is a fresh line of support.
And of course, the very round level of 0.70 looms large. It also worked as support. roles as support. If we dig deeper, 0.6850 is the final line.
I remain bearish on NZD/USD
The pair is pressed by both sides: expectations for a rate cut in New Zealand either in June or July, and rising chances of an earlier than predicted rate hike in the US.
In this week’s podcast, we explain why EUR rallied on Draghi, what’s next, discuss oil and gas, run through the Plus500 story and preview next week’s events.
Further reading:
- For a broad view of all the week’s major events worldwide, read the USD outlook.
- For EUR/USD, check out the Euro to Dollar forecast.
- For the Japanese yen, read the USD/JPY forecast.
- For GBP/USD (cable), look into the British Pound forecast.
- For the Australian dollar (Aussie), check out the AUD to USD forecast.
- For USD/CAD (loonie), check out the Canadian dollar forecast.
