The Japanese yen continues to surge, as USD/JPY plunged 370 points last week. The pair closed at the 108 line. There are six events on this week’s schedule. Here is an outlook on the major events moving the yen and an updated technical analysis for USD/JPY.
Japan’s current account surplus widened to JPY 1.73 trillion, well above the estimate of JPY 1.57 trillion. In the US, ISM Non-Manufacturing PMI beat the estimate, and the Fed minutes indicated that an April hike was very unlikely.
do action=”autoupdate” tag=”USDJPYUpdate”/]
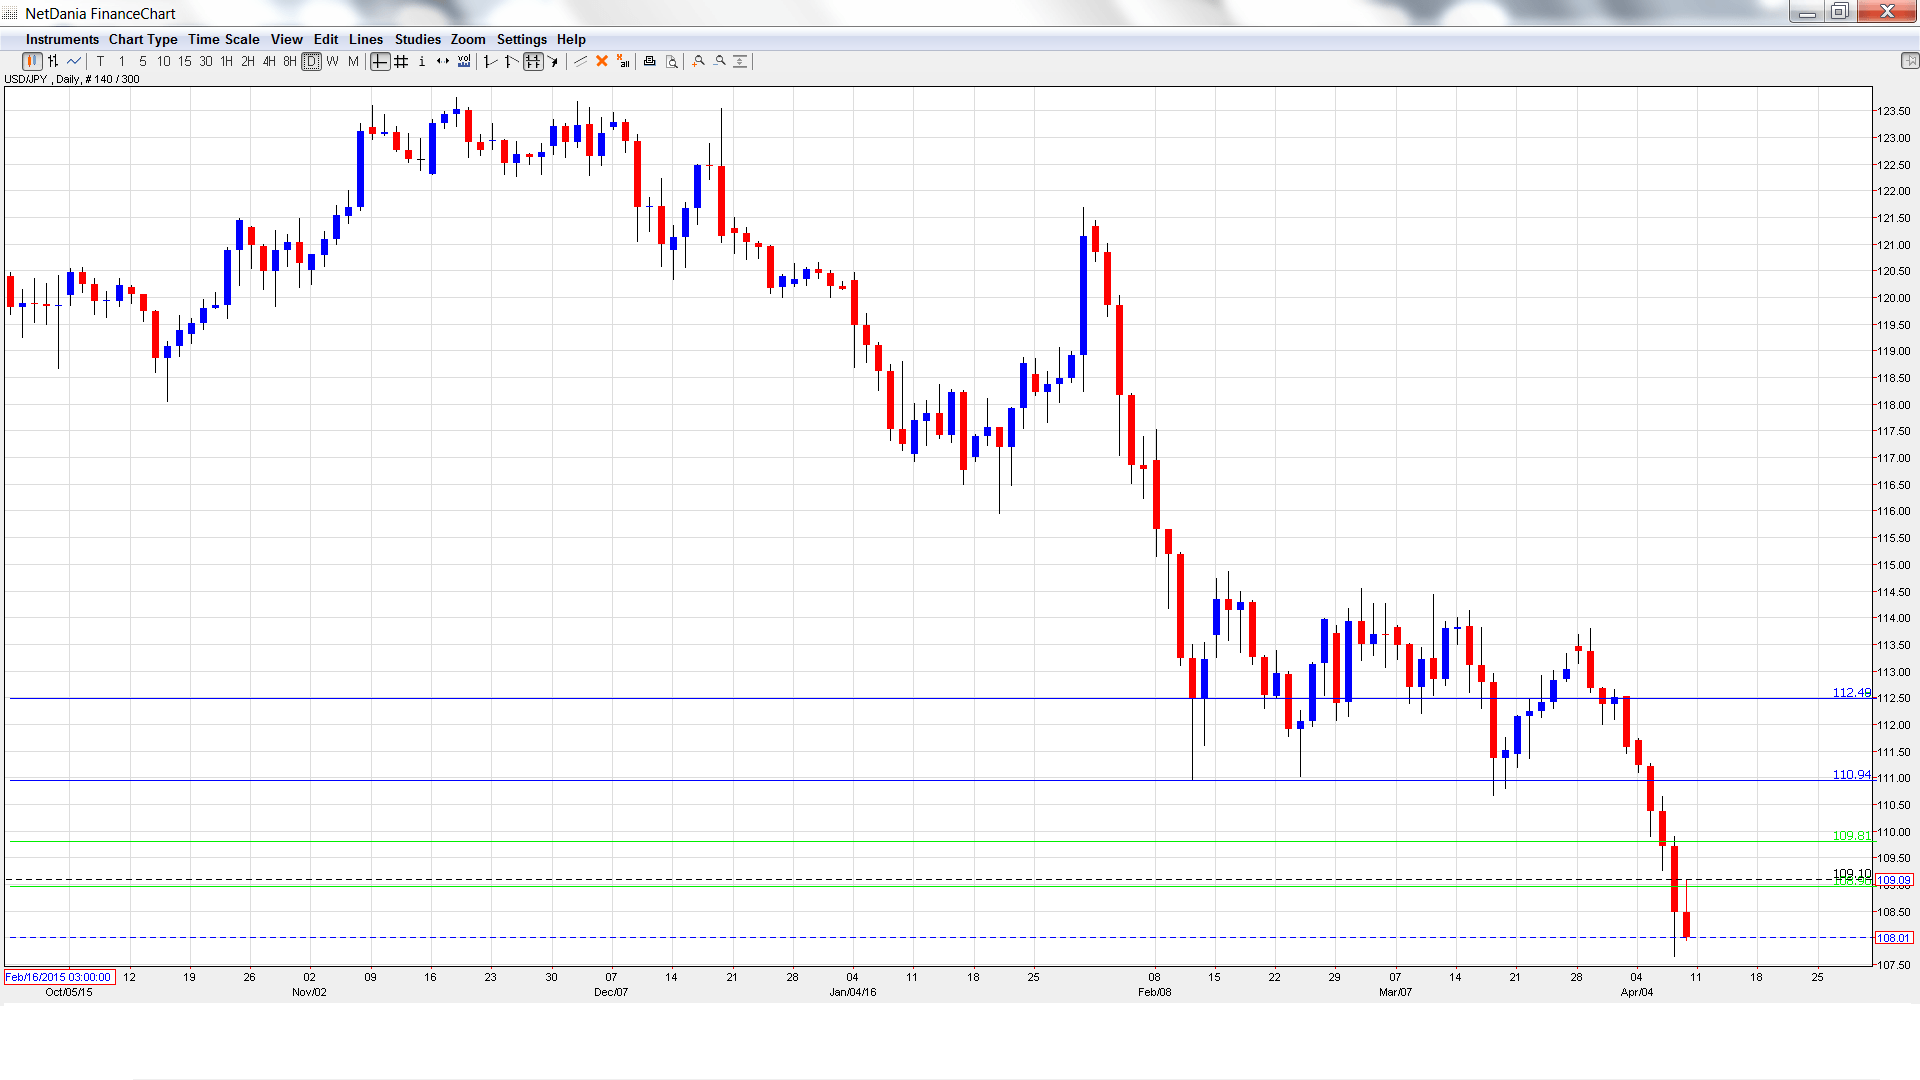
USD/JPY graph with support and resistance lines on it. Click to enlarge:
- Core Machinery Orders: Sunday, 23:50. This indicator was surprisingly strong in January, posting a gain of 15.0%. This was much higher than the estimate of 2.0%, and marked the highest gain in close to two years. However, the indicator is expected to drop sharply in February, with an estimate of -11.8%.
- Bank Lending: Monday, 23:50. Borrowing levels are closely linked to consumer spending, a key engine of economic growth. This indicator has been steady, and came in at 2.2% in February.
- Preliminary Machine Tool Orders: Tuesday, 6:00. The indicator continues to post declines, pointing to weakness in the manufacturing sector. In February, the indicator showed a sharp drop of 22.6%.
- M2 Money Stock: Tuesday, 23:50. This indicator has been fairly steady, with recent readings slightly above the 3.0% level. The indicator is expected to remain at 3.1% in the March release.
- 30-year Bond Auction: Thursday, 3:45. With the BoJ adopting negative rates, bond rates continue to drop. The yield on 30-year bonds dropped to 0.77% in the March auction, and we could see the downward trend continue in April.
- Revised Industrial Production: Friday, 4:30.The indicator rebounded in January with a strong gain of 3.7%, matching the forecast. However, the markets are expecting a sharp decline in February, with a forecast of -6.2%.
* All times are GMT
USD/JPY Technical Analysis
USD/JPY opened the week at 111.69 and quickly touched a high of 111.74. The pair then dropped sharply to a low of 107.65, as support held firm at 107.39 (discussed last week). USD/JPY closed the week at 108.01.
Live chart of USD/JPY: [do action=”tradingviews” pair=”USDJPY” interval=”60″/]
Technical lines from top to bottom:
With USD/JPY posting sharp losses last week, we start at lower levels:
112.48 is a strong resistance line. The line marked the start of a yen rally in January 2008, which saw USD/JPY drop below the 100 level.
110.94 was a cushion February.
109.81 is the next resistance line.
108.95 was a cushion in May 2006.
107.39 is the next support level.
106.25 marked the start of a dollar rally in October 2014 which saw USD/JPY move above the 121 line.
105.19 was a cushion in October 2014.
104.25 is the final support line for now.
I am bearish on USD/JPY
The Fed minutes poured cold water on speculation of an April rate hike, and this could continue to weigh on the dollar. The yen is on a tear and continue to move higher this week.
In our latest podcast we explain why the doves do NOT cry.
Follow us on Sticher or on iTunes
Further reading:
- For a broad view of all the week’s major events worldwide, read the USD outlook.
- For EUR/USD, check out the Euro to Dollar forecast.
- For the Japanese yen, read the USD/JPY forecast.
- For GBP/USD (cable), look into the British Pound forecast.
- For the Australian dollar (Aussie), check out the AUD to USD forecast.
- For the kiwi, see the NZDUSD forecast.
