USD/JPY posted modest gains last week and closed just below the 106 level. This week’s key events are Tokyo Core CPI, Retail Sales and the BoJ Monetary Policy Statement. Here is an outlook for the highlights of this week and an updated technical analysis for USD/JPY.
There were no major Japanese releases last week, but USD/JPY still showed some volatility as Prime Minister Abe is expected to put together a significant spending package. The yen posted gains after BoJ Governor Haruhiko Kuroda rejected the idea of using helicopter money to combat deflation. In the US, construction numbers were steady, as Building Permits and Housing Starts met expectations.
do action=”autoupdate” tag=”USDJPYUpdate”/]
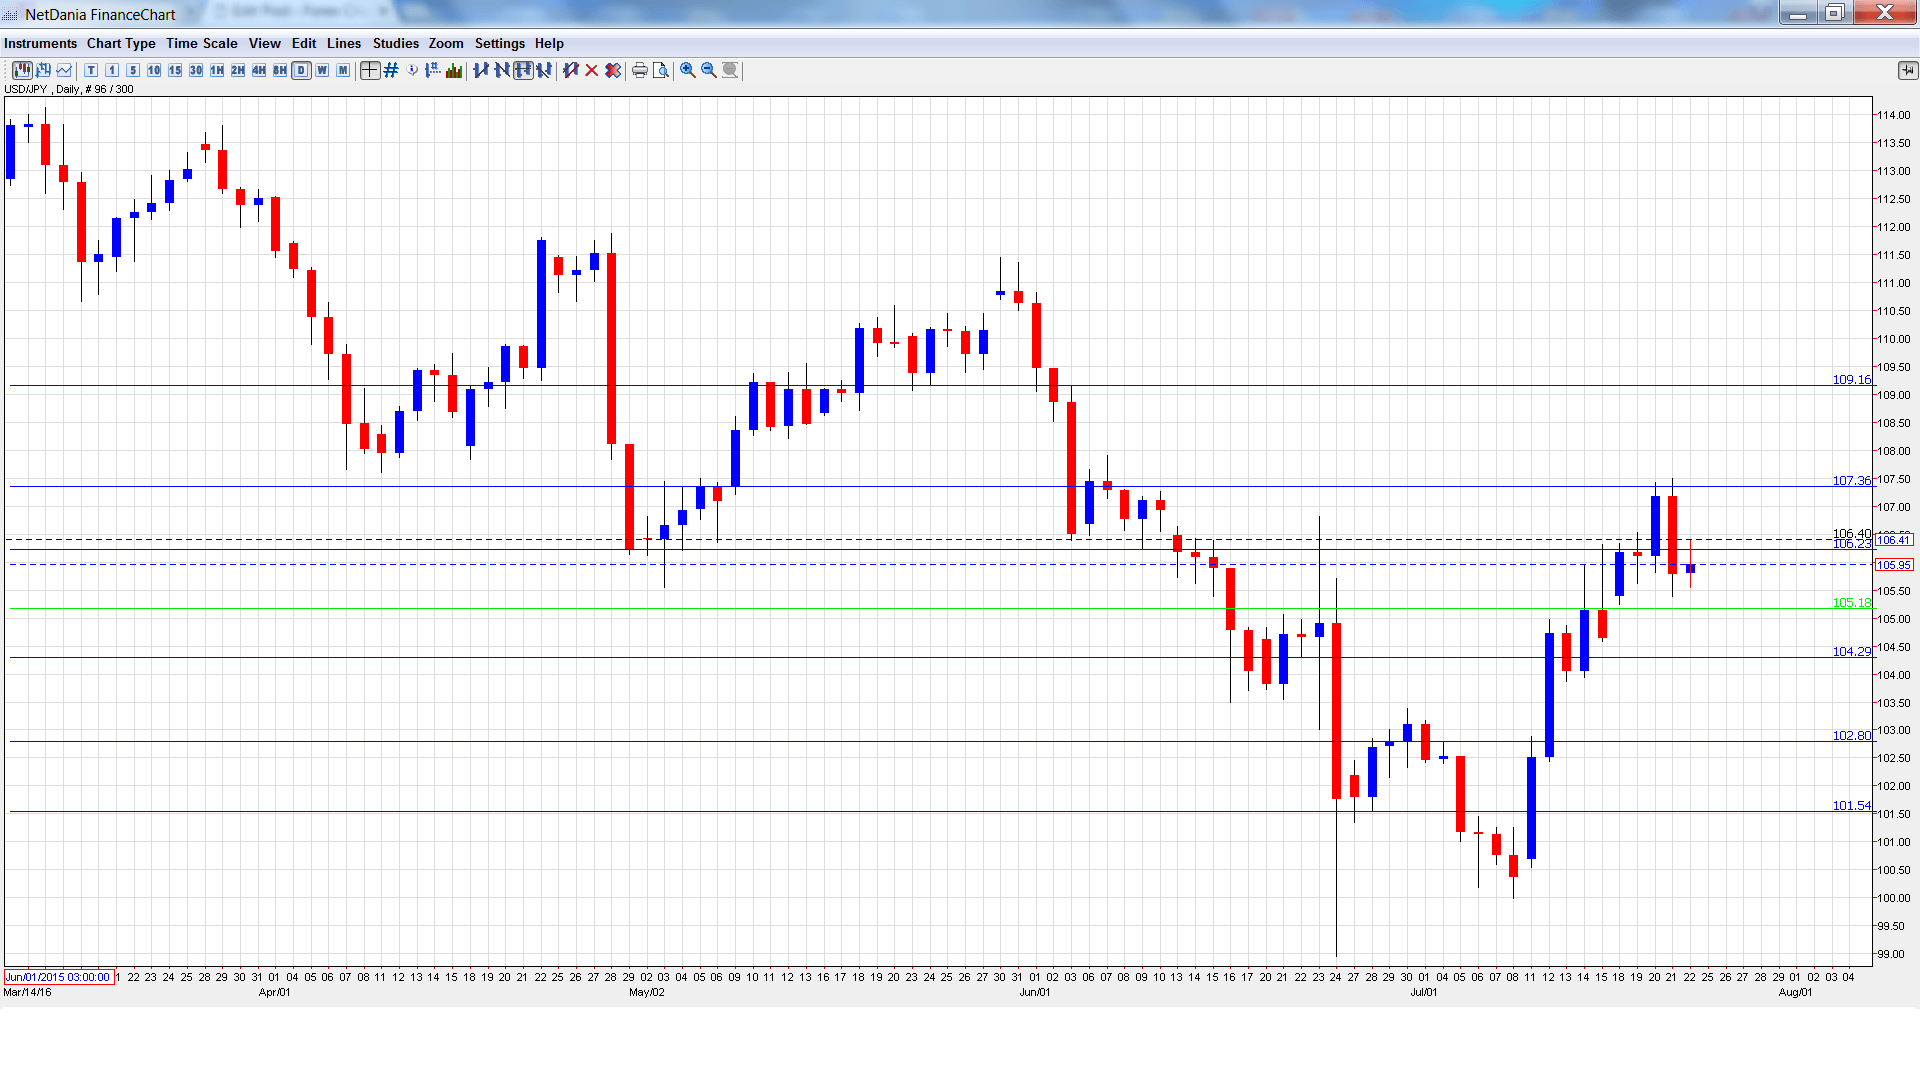
USD/JPY graph with support and resistance lines on it. Click to enlarge:
- SPPI: Monday, 23:50. This indicator measures inflation in the corporate sector. The index has been very steady, posting five straight readings of 0.2%. Little change is expected in the June release.
- Household Spending: Thursday, 23:30. This indicator continues to struggle, as it has posted only one gain since September 2015. The indicator declined 1.1% in May, and a drop of 0.4% is expected in the June release.
- Tokyo Core CPI: Thursday, 23:30. This is the key event of the week and should be treated as a market-mover. The index has posted six straight declines, pointing to deflation in Japan. The estimate for the July reading stands at -0.4%.
- Retail Sales: Thursday, 23:50. Retail Sales is the primary gauge of consumer spending, and an unexpected reading can have a strong effect on the movement of USD/JPY. The indicator has managed just one gain since November, and the decline of 1.9% in May was the sharpest drop in over a year. Another weak reading is expected in June, with an estimate of -1.2%.
- BoJ Monetary Policy Statement: Friday, Tentative. The BoJ will publish its monetary policy statement. It’s not clear that the bank will adopt further easing measures, although with the economy gripped by deflation, there is strong pressure on the bank to take action.
- BoJ Outlook Report: Monday, 5:00. This report, published each quarter, provides details of economic conditions and inflation, which are key factors in determining monetary policy.
* All times are GMT
USD/JPY Technical Analysis
USD/JPY opened the week at 105.39 and quickly touched a low of 105.25. The pair climbed to a high of 107.49, testing resistance at 107.39 (discussed last week). The pair was unable to consolidate at these levels and closed the week at 105.95.
Live chart of USD/JPY: [do action=”tradingviews” pair=”USDJPY” interval=”60″/]
Technical lines from top to bottom:
109.18 was a cap in September 2008.
107.39 was tested in resistance as the pair posted sharp gains before retracting.
106.25 is currently weak resistance. It could see action early in the week.
105.19 was a cushion in October 2014. It is an immediate support line.
104.25 is next.
102.80 is a strong support line.
101.51 was a cushion in August 2014. It is the final support line for now.
I remain bullish on USD/JPY
The BoJ is under pressure to make adopt further easing measures, which would push the yen lower. US releases have looked solid recently, raising speculation that the Fed may raise rates before the end of the year.
Our latest podcast is titled Oil down, gold up and the upcoming Fed-fest
Follow us on Sticher or on iTunes
Further reading:
- For a broad view of all the week’s major events worldwide, read the USD outlook.
- For EUR/USD, check out the Euro to Dollar forecast.
- For the Japanese yen, read the USD/JPY forecast.
- For GBP/USD (cable), look into the British Pound forecast.
- For the Canadian dollar (loonie), check out the Canadian dollar forecast.
- For the kiwi, see the NZD/USD forecast
