AUD/USD posted slight losses for a second straight week, as the pair closed at 0.7539. This week’s key event is Employment Change. Here is an outlook on the major market-movers and an updated technical analysis for AUD/USD.
In the US, a sparking jobs report has virtually ensured a rate hike coming next week. Still, wage growth disappointed, falling short of the forecast. In Australia, the RBA maintained rates at 1.50%. As well, Retail Sales improved to 0.4%, matching the estimate.
[do action=”autoupdate” tag=”AUDUSDUpdate”/]
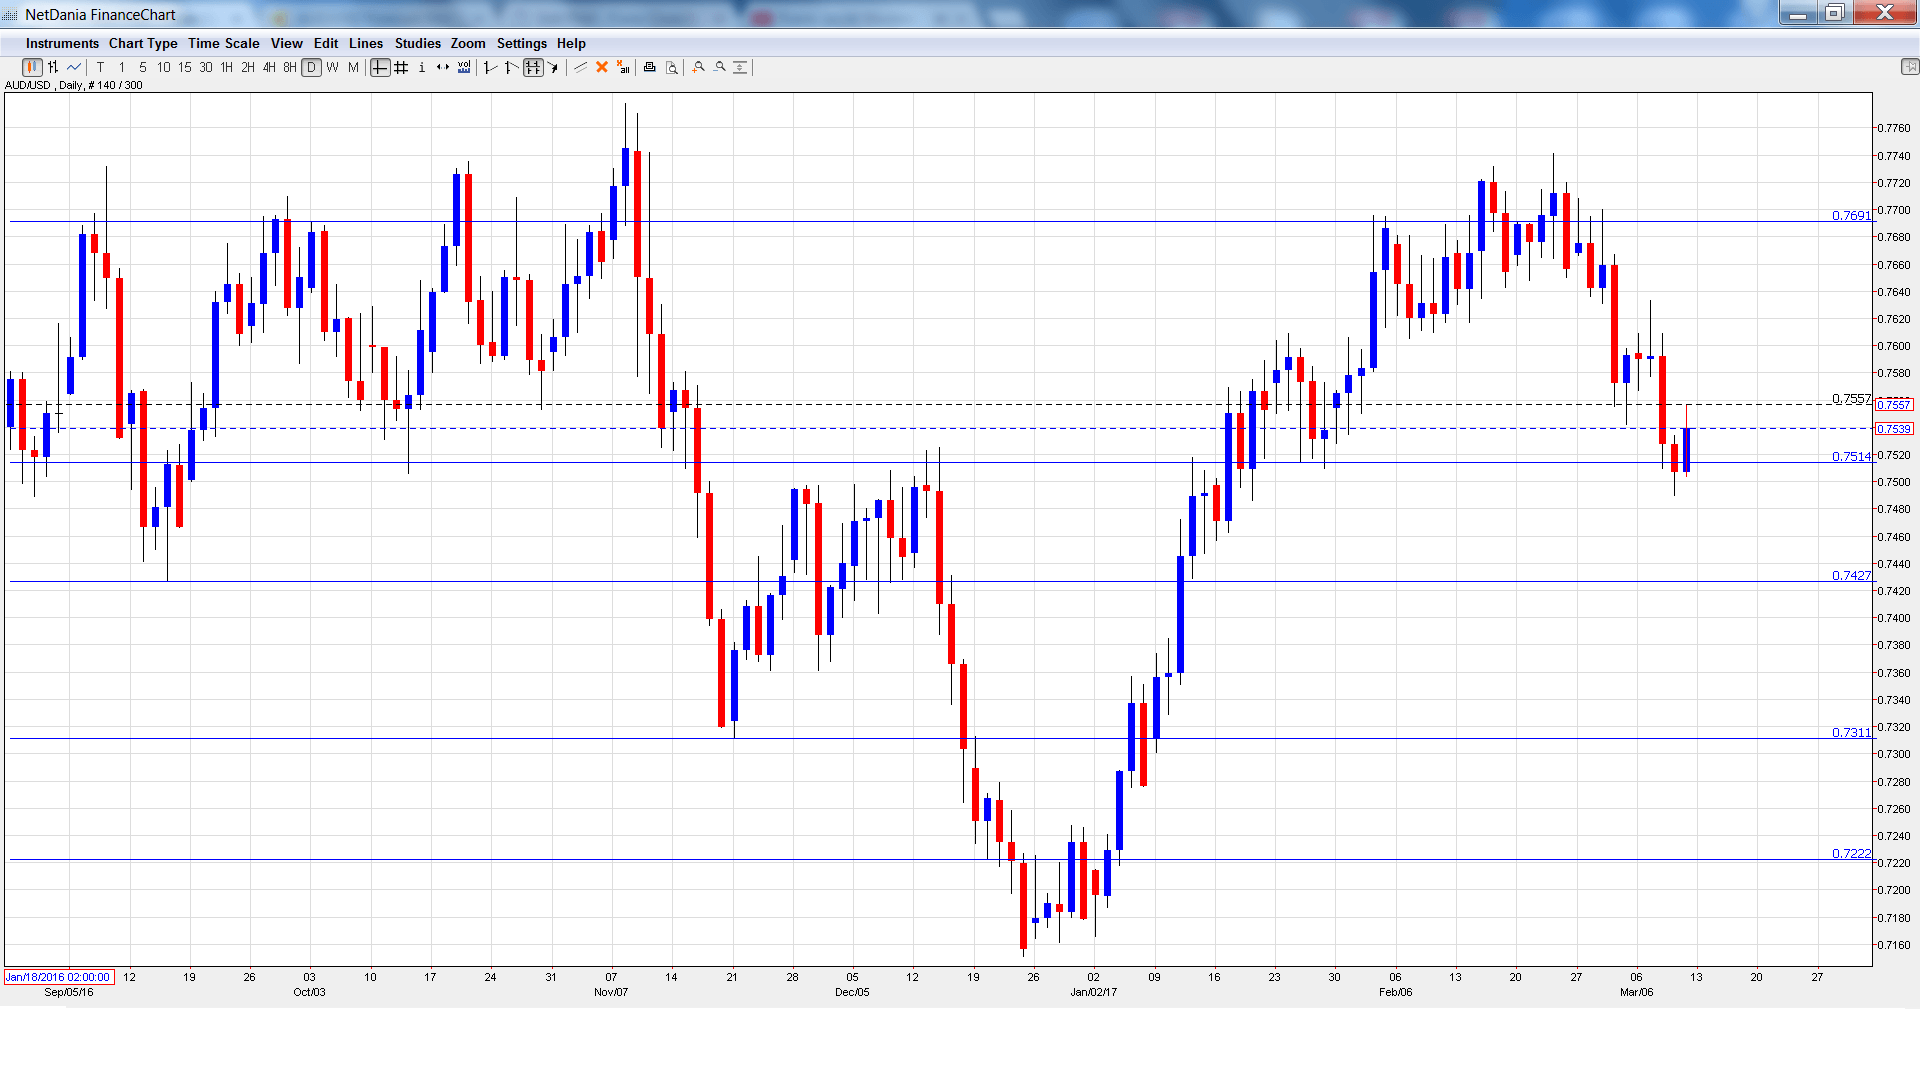
AUD/USD daily graph with support and resistance lines on it. Click to enlarge:
- NAB Business Confidence: Tuesday, 00:30. The indicator jumped to 10 points January, indicative of stronger optimism. Will the upswing continue in the February report?
- Chinese Industrial Production: Tuesday, 2:00. There was no release in February due to the Chinese New Year, so the upcoming release will include January and February data. The estimate stands at 6.2%.
- Westpac Consumer Sentiment: Tuesday, 23:30. Consumer Confidence came in at 2.3% in March, its strongest gain since May 2016. Stronger consumer confidence should translate into higher consumer spending, a key component of economic growth.
- New Motor Vehicle Sales: Wednesday, 00:30. This important consumer spending indicator gained 0.6% in February, marking a 4-month high. The indicator has posted two straight gains, breaking a trend of two consecutive declines.
- MI Inflation Expectations: Thursday, 00:00. Analysts use this indicator to help predict actual inflation data. The indicator dipped to 4.1% in February, compared to 4.3% in the previous release.
- Employment Change: Thursday, 00:30. This is one of the most important indicators, and an unexpected reading can affect the movement of AUD/USD. The unemployment rate is expected to remain at 5.7%.
- RBA Bulletin: Thursday, 00:30. This minor report is released quarterly. It contains an analysis of current and future economic conditions.
AUD/USD Technical Analysis
AUD/USD opened the week at 0.7594 and climbed to a high of 0.7633. The pair reversed directions and dropped to a low of 0.7490, testing support at 0.7513 (discussed last week). AUD/USD closed the week at 0.7539.
Live chart of AUD/USD:
Technical lines from top to bottom:
We begin with resistance at 0.8066.
0.7938 is next. This line has held in resistance since May 2015.
0.7835 was the high point in April 2016.
0.7691 is the next line of resistance.
0.7513 was tested in support and remains a weak line. It was a cushion in April 2015.
0.7427 is next.
0.7311 marked a low point in November.
0.7223 is the final support level for now.
I am bearish on AUD/USD
The markets have priced in an expected rate hike next week in the US, but the move should still reinvigorate the markets and push up the US dollar. With the RBA standing pat last week, monetary divergence continues to favor the greenback.
Our latest podcast is titled March hike, Macron, and Mario Draghi
Follow us on Sticher or iTunes
Safe trading!
Further reading:
- For a broad view of all the week’s major events worldwide, read the USD outlook.
- For EUR/USD, check out the Euro to Dollar forecast.
- For the Japanese yen, read the USD/JPY forecast.
- For GBP/USD (cable), look into the British Pound forecast.
- For the Canadian dollar (loonie), check out the Canadian dollar forecast.
- For the kiwi, see the NZD/USD forecast.
