The New Zealand dollar suffered under the fresh strength of the US dollar and falling milk prices. The GDP report is left, right and center now. Here is an analysis of fundamentals and an updated technical analysis for NZD/USD.
The GDT auction showed a drop in prices once again, and this time the rate was nearly double the previous fall. A dive of 6.3% could not be ignored. In the US, the greenback made another push forward towards the highly anticipated rate hike.
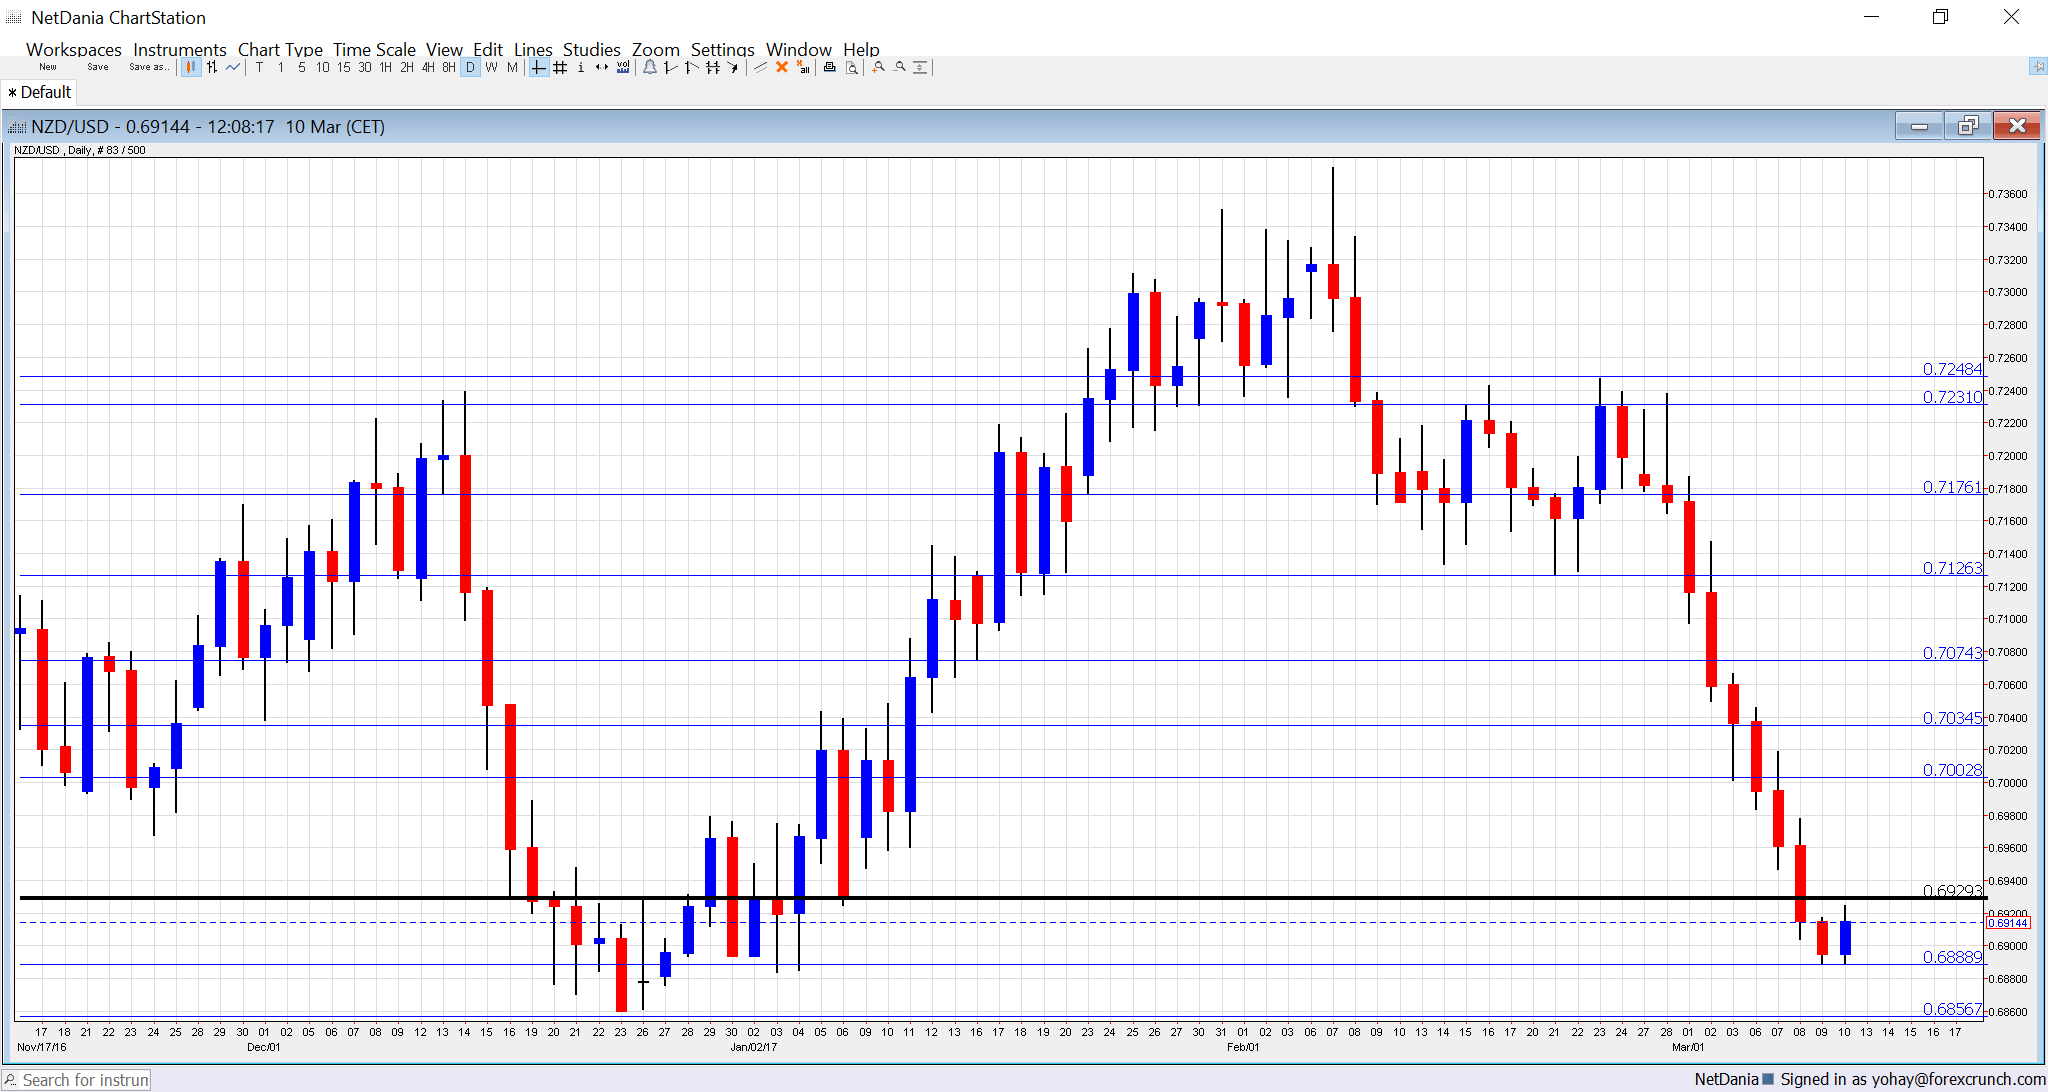
[do action=”autoupdate” tag=”NZDUSDUpdate”/]NZD/USD daily graph with support and resistance lines on it. Click to enlarge:
- FPI: Sunday, 21:45. The Food Price Index also plays a role in shaping expectations for the kiwi. Contrary to the GDT figure, the last number released here was positive: an increase of 2.8%.
- Current Account: Tuesday, 21:45. Similar to the narrower trade balance measure, New Zealand’s current account suffers a deficit. After a deficit of nearly 5 billion NZD, a smaller one could be seen now. These figures are affected by seasonality.
- GDP: Wednesday, 21:45. New Zealand’s economy expanded very nicely in Q3 2016: by 1.1% q/q. A slower growth rate could be seen now. Note that New Zealand publishes its GDP data very late in the quarter, and there is only one release.
- Business NZ Manufacturing Index: Thursday, 21:30. This measure of New Zealand’s manufacturing sector showed slower growth in January, with a score of 51.6 points. A slightly stronger figure is on the cards now.
NZD/USD Technical Analysis
Kiwi/dollar was under the cosh at the beginning of the week. The pair slipped towards the 0.6960 line mentioned last week.
Technical lines, from top to bottom:
0.7380 was the high recorded back in February and is our top line for now. Below, we find 0.7250, which capped the pair back twice in mid-February and serves as a double top.
0.7160, which capped the pair back in November is a pivotal line within the range. 0.7125 worked as a double bottom before it collapsed in early March.
0.7075 served as resistance back in November and then worked as a stepping stone on the way up. It is followed by 0.7035 that worked as resistance in early January.
The very round number of 0.70 is a battle zone. Further below, 0.6960 worked as support in November and then in January once again.
The round number of 0.69 is weak support and it is followed by 0.6865.
I am bullish on NZD/USD
The GDP report could remind us that the New Zealand economy is doing quite well. In the US, the rate hike is priced in.
Our latest podcast is titled Fed fever and crashing crude in the Ides of March
Follow us on Sticher or iTunes
“‹
Safe trading!
