GBP/USD tumbled down on fears of a no-deal Brexit and the Turkish crisis. What’s next? Three top-tier indicators await the pound in the upcoming week. Here are the key events and an updated technical analysis for GBP/USD.
UK Q2 GDP came out at 0.4% as broadly expected. Other figures were slightly better with upbeat manufacturing output and a narrower trade balance. UK International Trade Minister Liam Fox said that there is a 60% of not reaching a deal on Brexit and this weighed on the pound. Soothing words from Chancellor of the Exchequer Phillip Hammond did not help. The fall of the Turkish Lira became a global crisis after the ECB warned about implications for euro-zone banks. The pound got carried away in the risk-off atmosphere which had already been in place due to the trade tensions between the US and China. In the US, Core CPI came out at 2.4% y/y, better than expected.
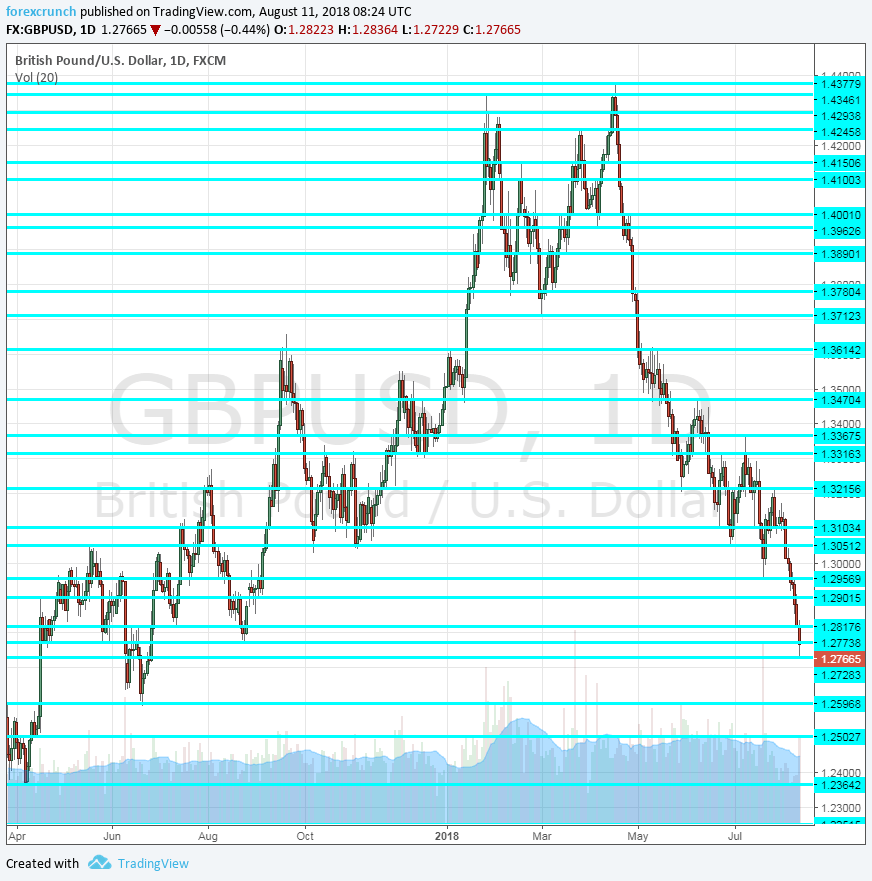
[do action=”autoupdate” tag=”GBPUSDUpdate”/]GBP/USD daily graph with resistance and support lines on it. Click to enlarge:
- Jobs report Tuesday, 8:30. The UK enjoys a low unemployment rate which stood at 4.2% in May but wages are not rising at a satisfactory pace: only 2.5% in May, barely above inflation. The Average Earnings Index is the focus of the report. Both figures are expected to remain unchanged. The change in jobless claims, known in the UK as the Claimant Count Change, rose by a disappointing 7.8K in June. We will now get the fresh figures for July.
- Inflation report: Wednesday, 8:30. The headline Consumer Price Index rose by 2.4% y/y in June, below expectations. The Bank of England still raised rates, but the relatively low level of inflation contributed to the dovish nature of the hike. Core CPI stood at 1.9% y/y and the Retail Price Index (RPI) was at 3.4%. We will now get the figures for July which are forecast to show CPI at 2.5%, Core CPI at 1.9% and the RPI at 3.4%.
- Retail sales: Thursday, 8:30. This is a volatile figure that has a short-lived but powerful impact on the pound. The volume of sales dropped by 0.5% in June despite hopes for a positive impact from the World Cup. A bounce back is on the cards for June: a rise of 0.2%.
* All times are GMT
GBP/USD Technical analysis
Pound/dollar lost ground on a daily basis and the losing streak is now seven consecutive trading days of falls. The low point was 1.2723.
Technical lines from top to bottom:
1.3215 was the high point for the pair in mid-July and a lower high on the chart.
1.3100 was a swing low in mid-June and 1.3050 was a previous 2018 low.
Below 1.3000 we find 1.2955, a mid-July low. The round number of 1.2900 was a low point in the fall of 2017. 1.2820 was also an old line from mid-2017.
1.2722 is the new 2018 low. 1.2590 was a swing low in September 2017. Even lower, 1.25 is a round number and also worked as support in early 2017.
I remain bearish on GBP/USD
Despite the extended fall and the potential resolution of the Turkish crisis, the pound remains vulnerable to Brexit. The adverse impact of the upcoming departure will likely show up in the economic data.
Our latest podcast is titled Brexit summer blues, trade troubles
Further reading:
- EUR/USD forecast – for everything related to the euro.
- USD/JPY forecast – projections for dollar/yen
- AUD/USD forecast – predictions for the Aussie dollar.
- USD/CAD forecast – Canadian dollar analysis
- Forex weekly forecast – Outlook for the major events of the week.
Safe trading!
