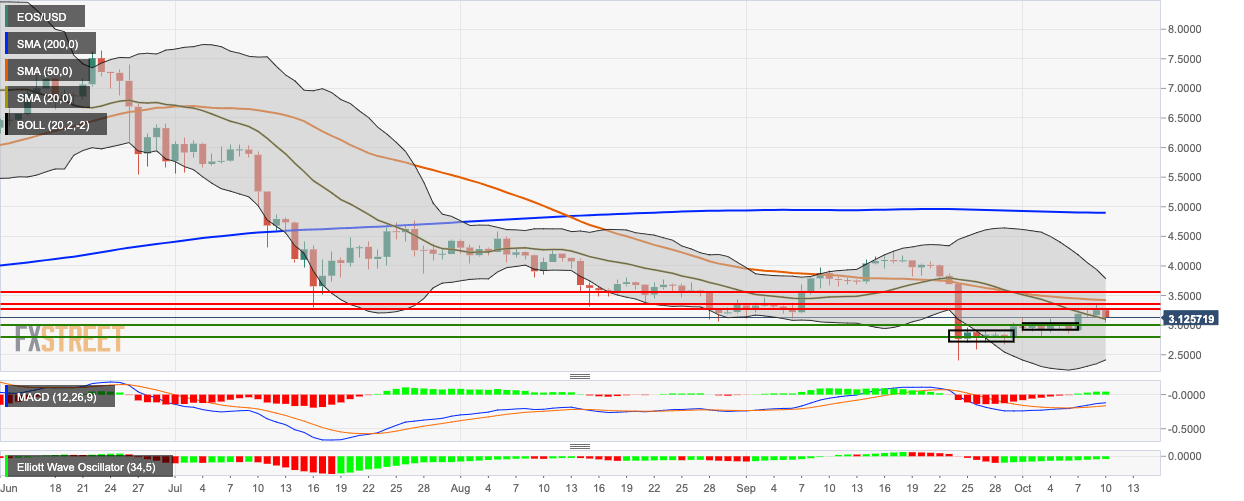
- The price is sandwiched between the SMA 20 and SMA 50 curves.
- The MACD indicator has had four straight bullish sessions of increasing intensity.
EOS/USD has gone down from $3.26 to $3.13 so far today. The price has been following a pattern of consolidation and breakout for over two weeks. EOS/USD is currently sandwiched between the 50-day Simple Moving Average (SMA 50) and SMA 20 curves (with SMA 20 on the downside). The bulls need to take the price up to $3.45 to trend above the SMA 50 curve.
EOS/USD daily chart
The Moving Average Convergence/Divergence (MACD) indicator has had four straight bullish sessions, while the Elliott Oscillator went up from -0.69 to -0.30 in 12 days. The 20-day Bollinger jaw has narrowed, indicating decreasing market volatility.

