- Dogecoin price fails to gain ground toward $0.3.
- The SuperTrend indicator sell signal prevails as further declines linger.
Dogecoin price action has gradually stabilized after a brief upswing from the previous week’s dip to $0.16. A break above $0.24 was believed to mark the beginning of an uptrend aiming for $0.3. Nonetheless, massive selling pressure oozing from the 200 Simple Moving Average (SMA) and the 50 SMA on the 12-hour chart cut short the bullish party. Those looking to buy dogecoin could benefit from entering on this dip but it’s a risk.
Meanwhile, the meme coin has settled above $0.24 amid a fierce tug war between the bulls and the bears. The bullish camp gazes at listing above $0.24, while the bears’ primary goal is to explore levels toward $0.16.
Where is Dogecoin price headed after the stalemate?
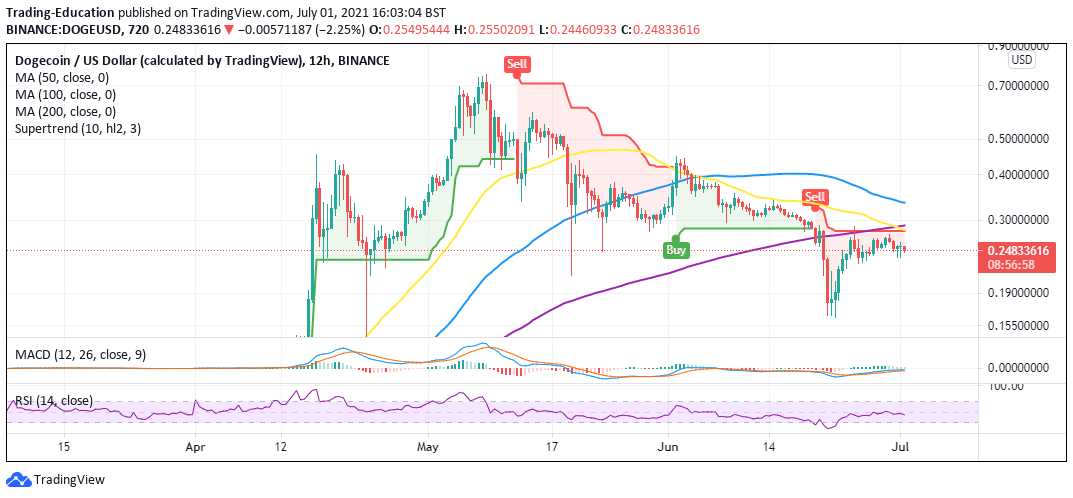
The price of Dogecoin teeters at $0.246 while bulls battle the immediate resistance at the confluence formed by the 50 SMA and the 200 SMA. If support at $0.24 holds, bulls will focus on cracking the barrier at $0.3.
Meanwhile, the overall technical picture leans to the bearish side based on the Relative Strength Index (RSI). In the wake of the losses to $0.16, the RSI rebounded above the midline. However, losses will likely soar as the trend strength Indicator makes way toward the oversold.
A death cross pattern recently came into the picture when the 50 moving average crossed above the longer-term 200 SMA. Usually, in a downward market, the 50 SMA trails the 200 SMA. As the downward pressure intensifies, the short-term moving average crosses beneath the longer-term moving average, identifying the impending flip from bullish to bearish.
While the golden cross does not signify entry positions or targets, it compels the trader to look for entry points.
Those looking for the next cryptocurrency to explode may wish to look elsewhere today.
DOGE/USD 12-hour chart sell signals
The IOMAP model by IntoTheBlock (ITB) cements the bears’ influence over the price by revealing the massive resistance zone between $0.2556 and $0.2631. Here, nearly 47,000 addresses previously scooped up approximately 6.2 billion DOGE. Trading above this zone will not be a walk in the park; thus, recovery may take longer to materialize.
Dogecoin IOMAP model highlights robust resistance
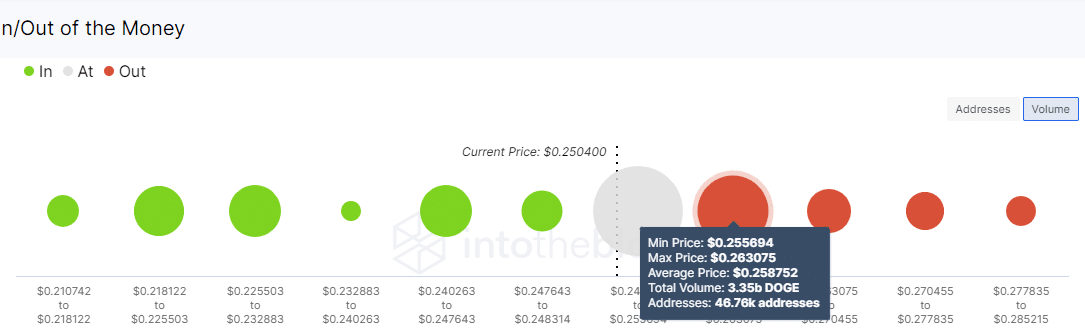
On the flip side, Dogecoin is sitting on relatively weak support areas, in turn adding credibility to the bearish notion. However, the model brings our attention to subtle buyer congestion between $0.24 and $0.2476. Here, roughly 21,400 addresses are currently profiting from the approximately 1.4 billion DOGE bought in the zone. In other words, this support area is not strong enough to hold the meme coin for long, and losses may gain traction.
Looking to buy or trade Dogecoin now? Invest at eToro!
67% of retail investor accounts lose money when trading CFDs with this provider. You should consider whether you can afford to take the high risk of losing your money.