- The Fed denies changes in interest rates and keeps them at 0% and 0.25%.
- DXY falls to its lowest level in July.
- A slowdown in inflation is expected due to the reduction of bottlenecks.
- The Delta variant continues to threaten recovery.
- Still awaiting employment, inflation and PMI data.
Although the Federal Reserve maintains an optimistic view of the economy, the DXY analysis showed a downtrend for 3 days following the refusal of the Fed to discuss a reduction in purchases.
–Are you interested to learn more about buying cryptocurrencies? Check our detailed guide-
The DXY is at its lowest point this month at 91.88. This was after the decision of the Federal Reserve on interest rates was made public. After two days of meetings, the Fed kept interest rates at 0% and 0.25% to continue supporting the economy during the pandemic. The Fed reiterated that the bank is not interested in changing interest rates and showed that the interest rates can be expected to increase gradually in 2023. For these reasons, the federal reserve is being pointed as responsible for weakening the Dollar.
The Fed Chair clarified that raising interest rates is not being considered until there is significant progress in the economy, meaning maximum employment, and price stability.
This decision comes at a time when the US is fighting the delta variant of Covid-19 and when the CDC has just approved new guidelines on the use of masks among vaccinated people.
In addition to maintaining interest rates, the Fed also expects inflation to slow as supply bottleneck effects diminish. Current inflation is above 2% and is the biggest concern of investors. This rate is higher than expected by the government but still meets long-term goals.
The current level of the DXY represents a drop of 1.1% on the week.
–Are you interested to learn more about forex robots? Check our detailed guide-
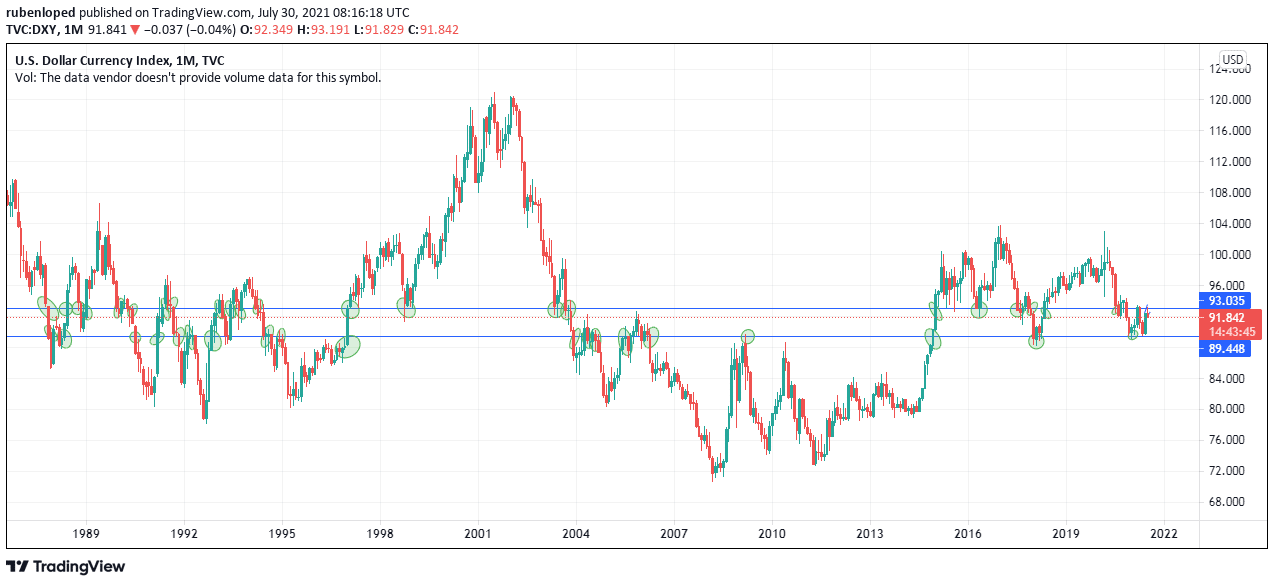
DXY technical analysis:
The DXY is moving in a historically significant zone between 89.5 and 93. This is a liquidity zone after which bullish momentum is evident.
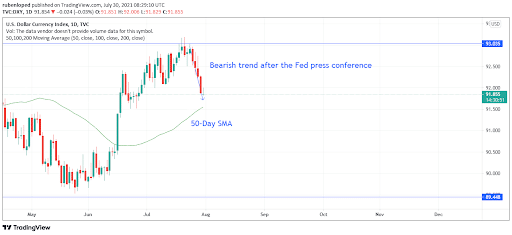
If we look at this week’s chart, we will see that the DXY reached a strong resistance level at 93 and then started a downtrend after the Fed press conference. The data that can redirect the trend will be the employment, inflation and PMI data.
The continued weakness of the dollar could cause the DXY index to slide towards the 50-day simple moving average.
Looking to trade forex now? Invest at eToro!
67% of retail investor accounts lose money when trading CFDs with this provider. You should consider whether you can afford to take the high risk of losing your money.
