- EUR/USD is trading near the 1.1065 resistance after the London close.
- Risk-on market mood and Brexit optimism are giving EUR/USD a boost.
- The Michigan Consumer Sentiment Index came out better-than-expected at 96 vs 92 for October.
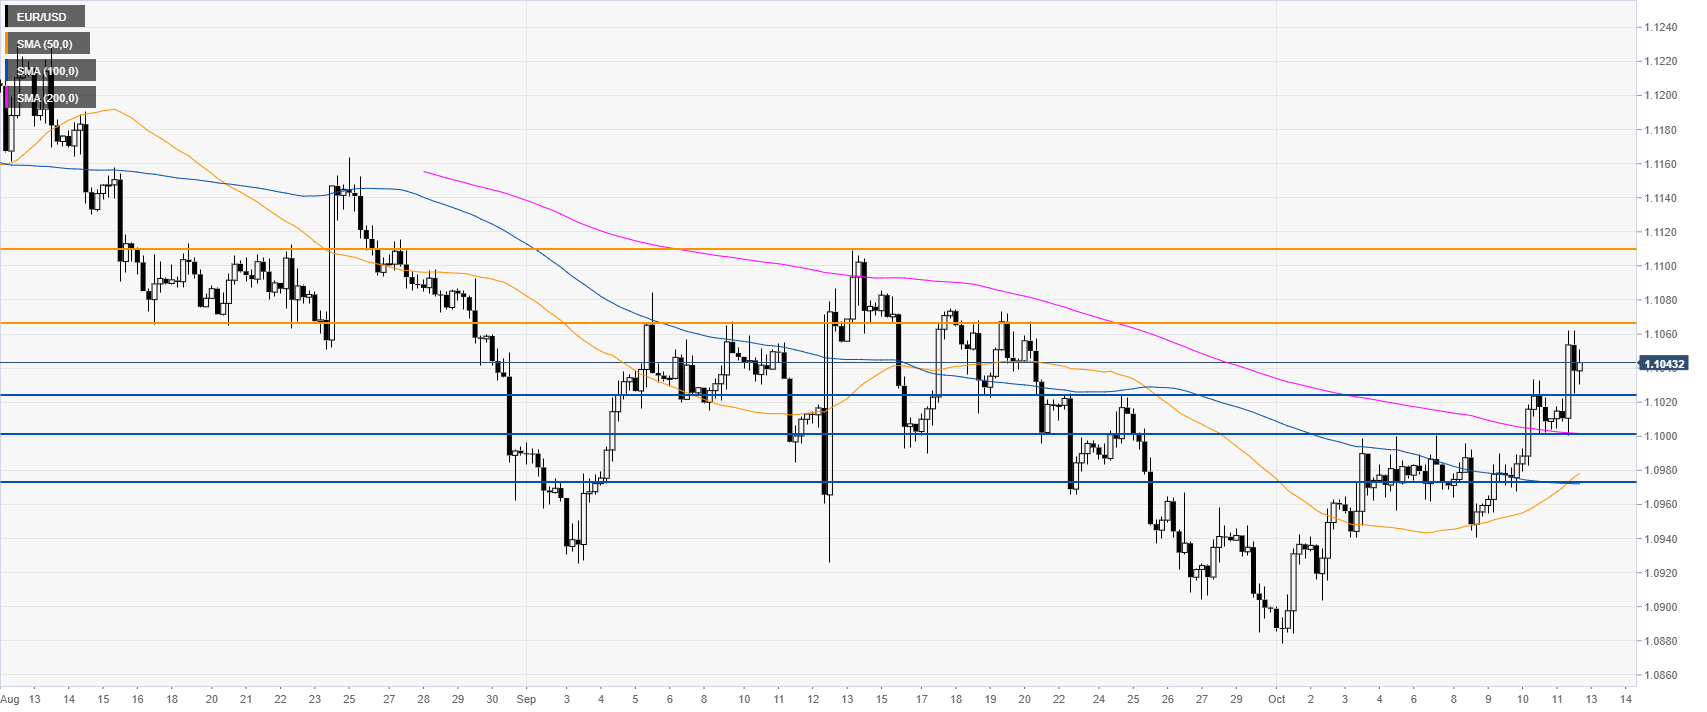
EUR/USD daily chart
On the daily chart, the common currency is trading in a bear trend below the 100 and 200-day simple moving averages (DSMAs). The spot is breaking above a multi-week trendline and the 50 SMA. On the macroeconomic front, the Michigan Consumer Sentiment Index came out better-than-expected at 96 vs 92 for October, having little to no effect on EUR/USD.

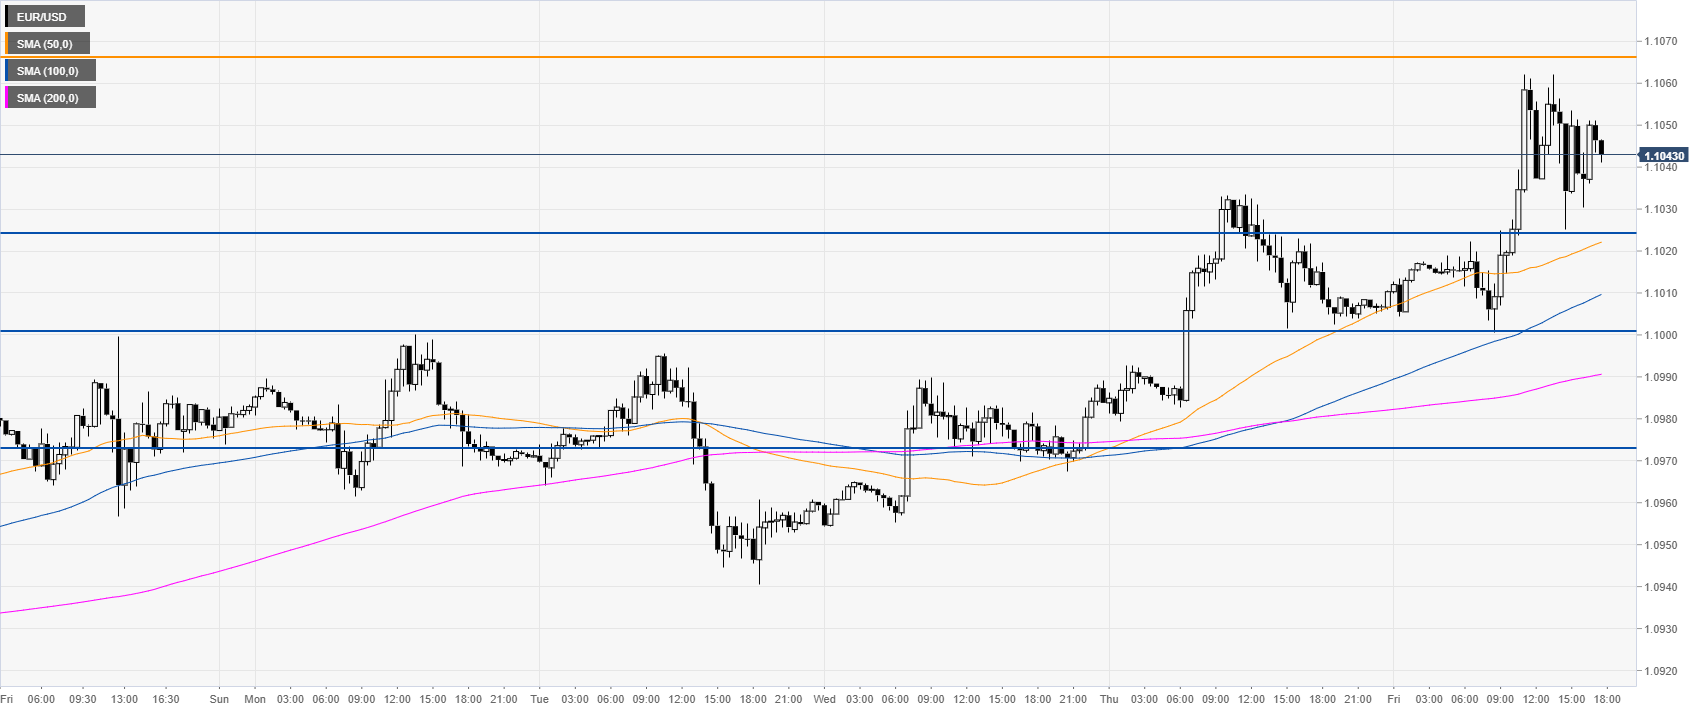
EUR/USD four-hour chart
The market is trading above its main SMAs, suggesting bullish momentum in the medium term. EUR/USD is consolidating the recent gains below the 1.1065 resistance as bulls are in control. A break above this level can expose the 1.1110 resistance, according to the Technical Confluences Indicator.
EUR/USD 30-minute chart
The Fiber is trading above its main SMAs, suggesting bullish momentum in the near term. Support can be seen at the 1.1025/07 zone and the 1.0972 price level.
Additional key levels
