EUR/USD changed course and fell in a week that saw central bank pressure from both sides. What lies on the road ahead? Here is an outlook for the highlights of this week and an updated technical analysis for EUR/USD.
Data in the euro-zone did not impress, with mixed PMIs and a slide in German confidence. But the trigger came from the central bank: ECB member Coeure hit the euro with talk about front-loading QE before the summer among other dovish comments. In the US, better than expected building data and still having the June hike option on the table helped the greenback recover against other currencies. Can the pair continue?
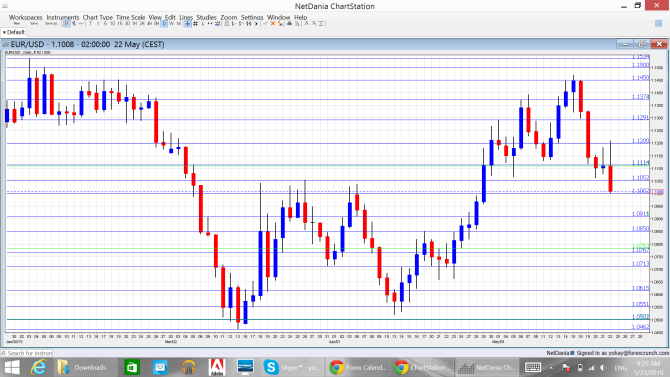
[do action=”autoupdate” tag=”EURUSDUpdate”/]EUR/USD daily chart with support and resistance lines on it. Click to enlarge:
- German GfK Consumer Climate: Wednesday, 6:00. According to this measure, consumers in Germany are becoming more confident, with the score hitting 10.1 points in April. A minor slide to 10 points is expected now.
- ECB Financial Stability Report: Wednesday, 10:00. The European Central Bank releases this report twice per year and could use the opportunity to show if the QE program helped stability in its opinion.
- Belgian NBB Business Climate: Despite coming from a small country, this survey is highly regarded. In April, business climate fell to -6.2, below expectations. A small advance to -5.8 is on the cards. The negative number reflects worsening expectations.
- German Import Prices: Wednesday, 13:00. Prices of imported good also affect the inflation reads, especially when coming from the largest country. After a rise of 1% last time, a slower gain of 0.5% is on the cards now.
- German Retail Sales: Friday, 6:00. This important measure dropped sharply in March, by 2.3%. Consumers might have been affected by the Easter holiday. A rebound could be seen now.
- French Consumer Spending: Friday, 6:45. Spending dropped by 0.6% in the continent’s second largest economy in March. A bounce back with +0.4% is on the cards now.
- Spanish Flash CPI: Friday, 7:00. The zone’s fourth largest economy is one of the first to release inflation numbers, and its high deflation has also gained traction. After a y/y drop of 0.6% in April, a slide of 0.5% is on the cards for May.
- ECB Lending data: Friday, 8:00. The ECB’s monetary stimulus is finally having a real impact. After long months of negative numbers, private loans have finally returned to growth territory, with a y/y rise of 0.1% in March. A gain of 0.4% is expected now for April. M3 Money Supply, or the money in circulation, is also on the move with 4.6% in March and expectations for +4.9% in April.
* All times are GMT
EUR/USD Technical Analysis
Euro/dollar started the week with a slide and never really staged a real recovery. 1.1050 (mentioned last week), held its ground for some time, but eventually collapsed and closed just above 1.10.
Live chart of EUR/USD: [do action=”tradingviews” pair=”EURUSD” interval=”60″/]
Technical lines from top to bottom:
We start from lower ground this time. The round level of 1.15 has a psychological impact and it also worked as support in the past. 1.1450 capped the pair during February’s recovery attempts and also during May.
Below, the historic line of 1.1373 (from November 2003) still has a role as resistance. 1.1290, which was a peak in April and support in February is significant resistance.
The round number of 1.12 served as resistance to a recovery attempt and is now a pivotal line. It is followed by a low seen in January of 1.1113 which is nearly 0.90 on USD/EUR.
1.1050 was a high point in March 2015 and now works as important support before the round level of 1.10. This is still a battle line.
The next line was minor support back in October 1999: 1.0910. It was resistance back then and was tested once again in March 2015. This is followed by 1.0815 which worked in both directions.
The next line is 1.0760, which was the low point in both July and August 2003. 1.0715 joins the chart after temporarily capping the pair in April 2015.
1.0660 worked nicely as support in April 2015. 1.0615, which worked in both directions during March 2015 and is better at support.
Another minor line is 1.0550, for a role as support in the same period of time. The very round level of 1.05 served as support during 2003. The lowest level in over 12 years is 1.0462 and this makes it critical support.
Below this point we have the very obvious level of 1 – EUR/USD parity, which is already eyed by more and more analysts.
I remain bearish on EUR/USD
The different directions between central banks finally set a decisive tone. This could be the long awaited last leg down for the euro and a last leg up for the greenback, and it could last for a while. Adding worsening euro area data and late signs of a spring recovery in the US, also indicators point to a clear direction: down.
In our latest podcast, we discuss commodity currencies, oil hedging and preview next week’s events.
Subscribe to Market Movers on iTunes
Further reading:
- For a broad view of all the week’s major events worldwide, read the USD outlook.
- For the Japanese yen, read the USD/JPY forecast.
- For GBP/USD (cable), look into the British Pound forecast.
- For the Australian dollar (Aussie), check out the AUD to USD forecast.
- USD/CAD (loonie), check out the Canadian dollar forecast
- For the kiwi, see the NZDUSD forecast.
