- The US Core Consumer Price Index (CPI) came out as expected at 2.4% YoY.
- The level to beat for bears is the 1.2200 support.
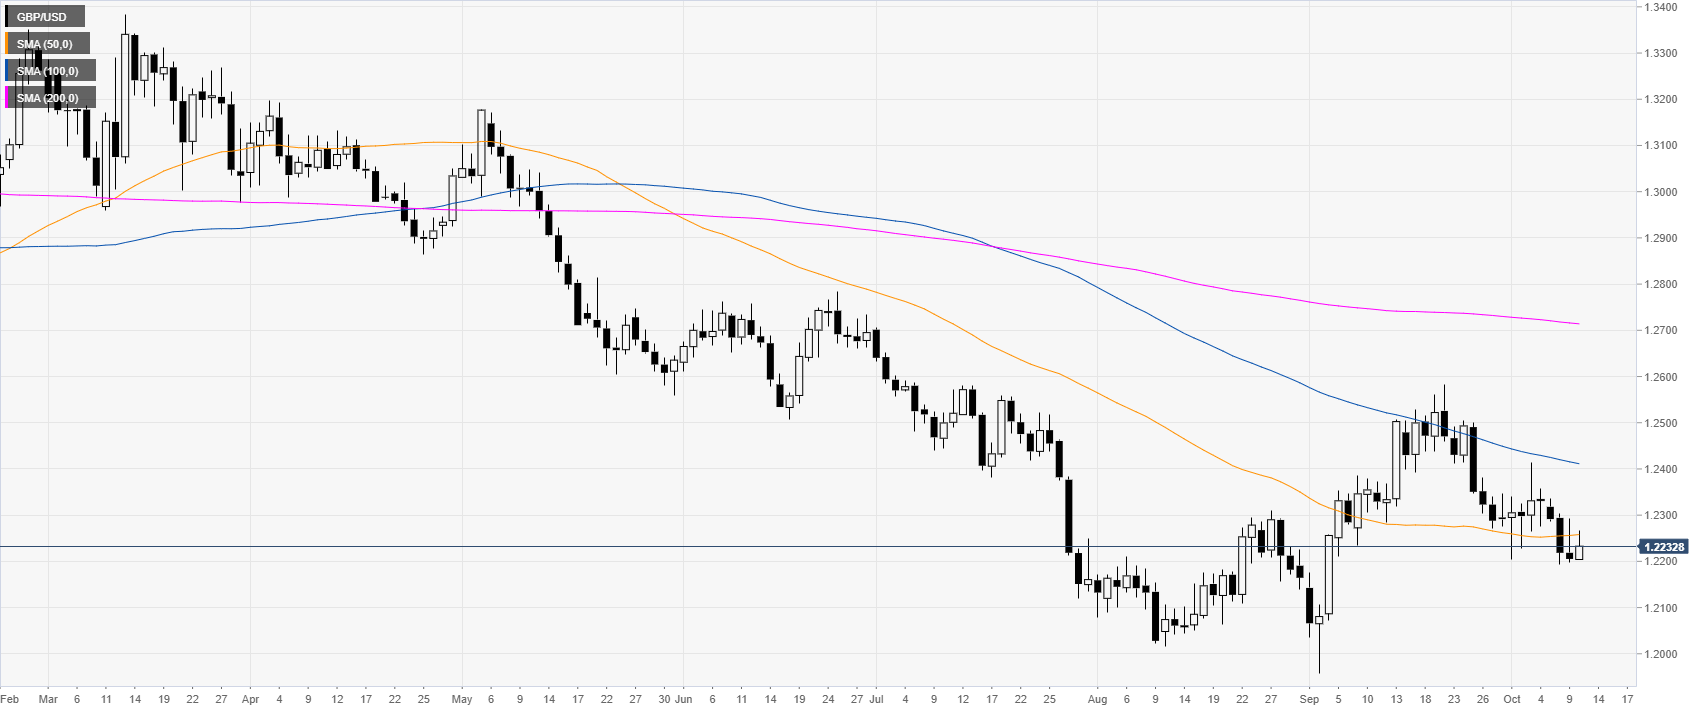
GBP/USD daily chart
On the daily chart, the Cable is trading in a downtrend below the main daily simple moving averages (DSMAs). The US Core Consumer Price Index (CPI) came out as expected at 2.4% YoY.
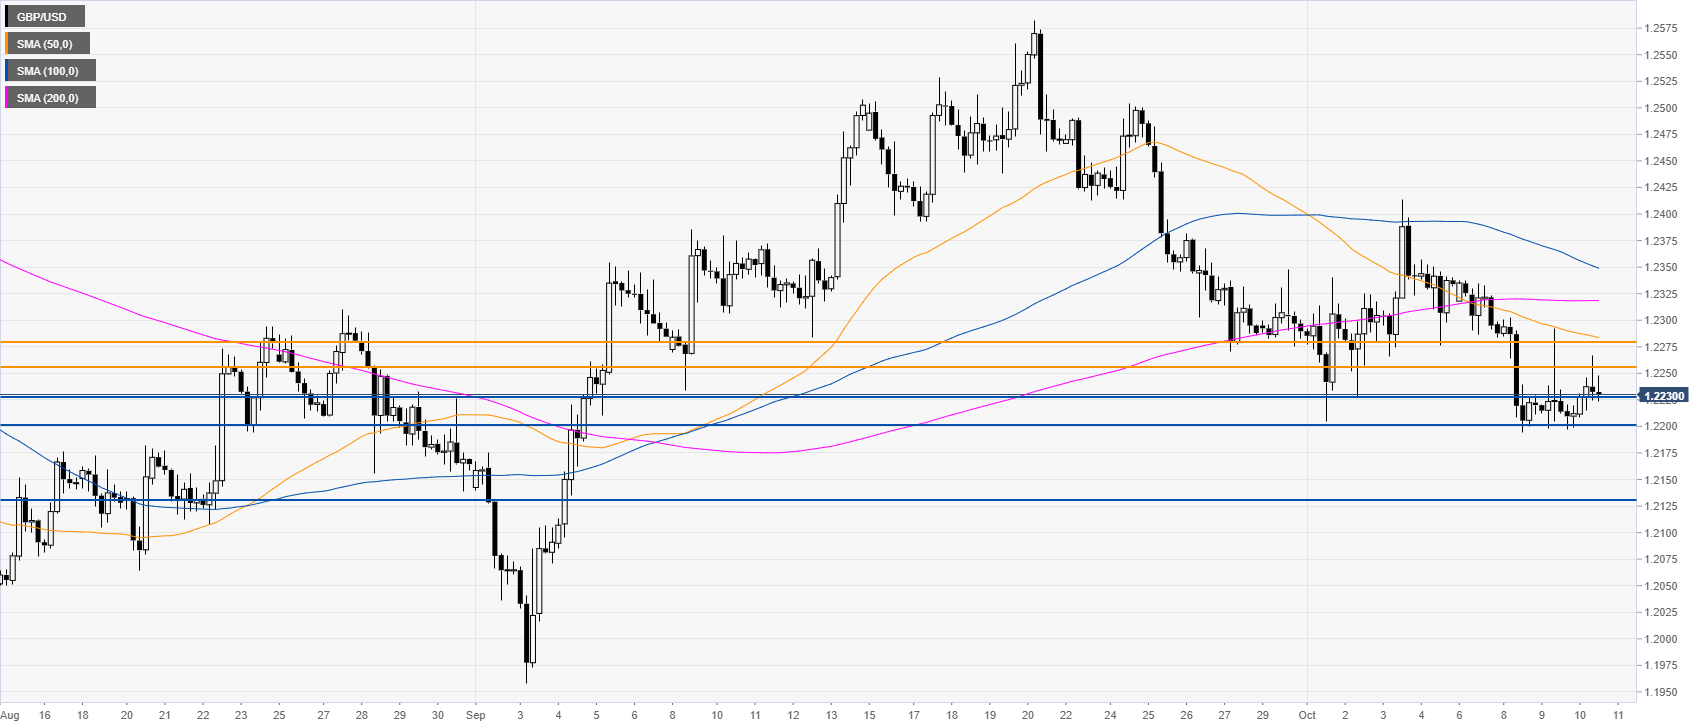
GBP/USD four-hour chart
GBP/USD is trading just above the 1.2200/1.2226 support zone. A break below 1.2200 is necessary for a breakdown towards 1.2130 support, according to the Technical Confluences Indicator.
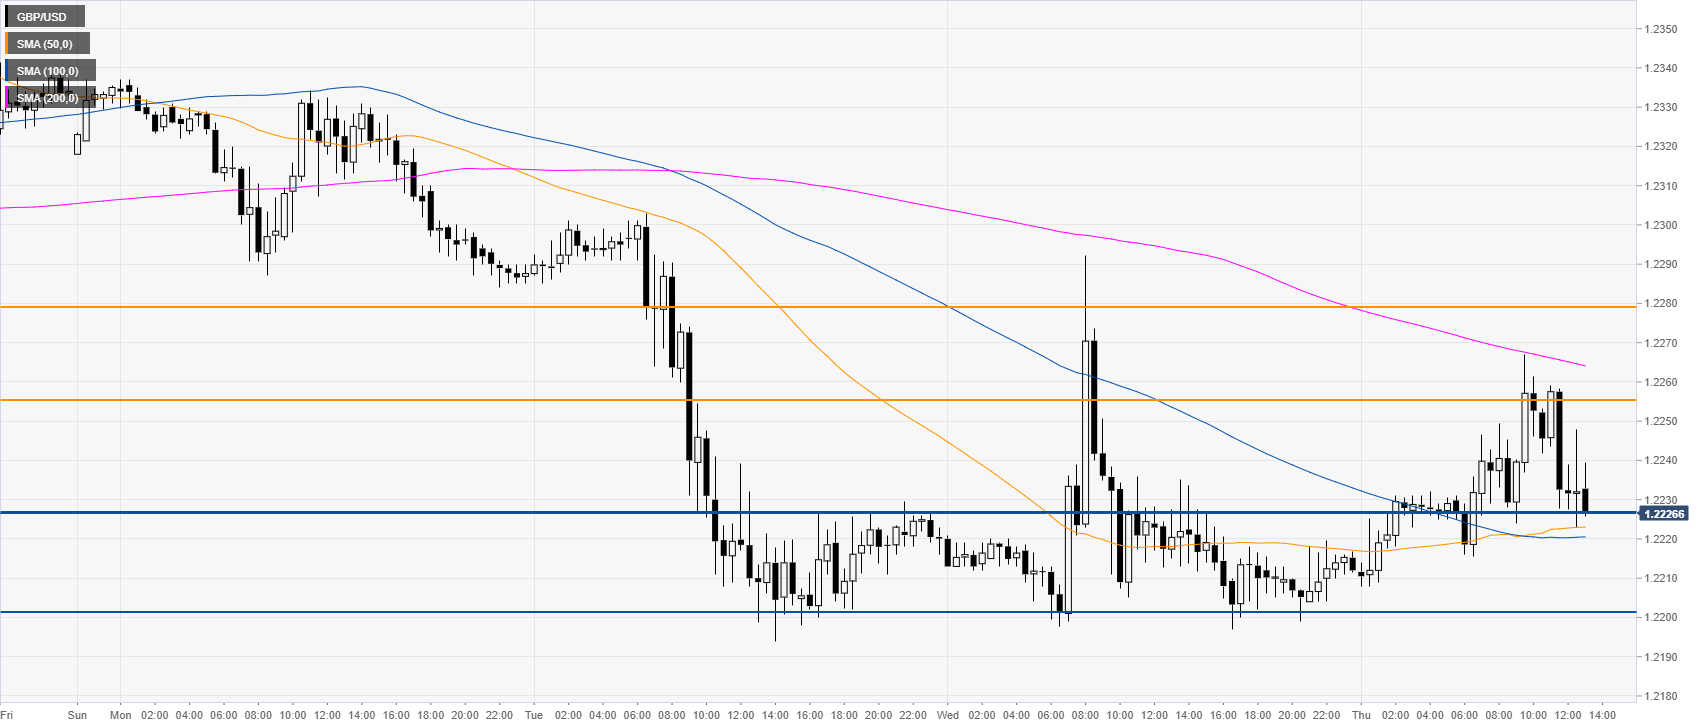
GBP/USD 30-minute chart
The Sterling is trading between the 100 and 200 SMAs, suggesting a consolidation phase in the near term. Resistances are seen at the 1.2255 and 1.2280 price levels, according to the Technical Confluences Indicator.
Additional key levels
