Hello traders,
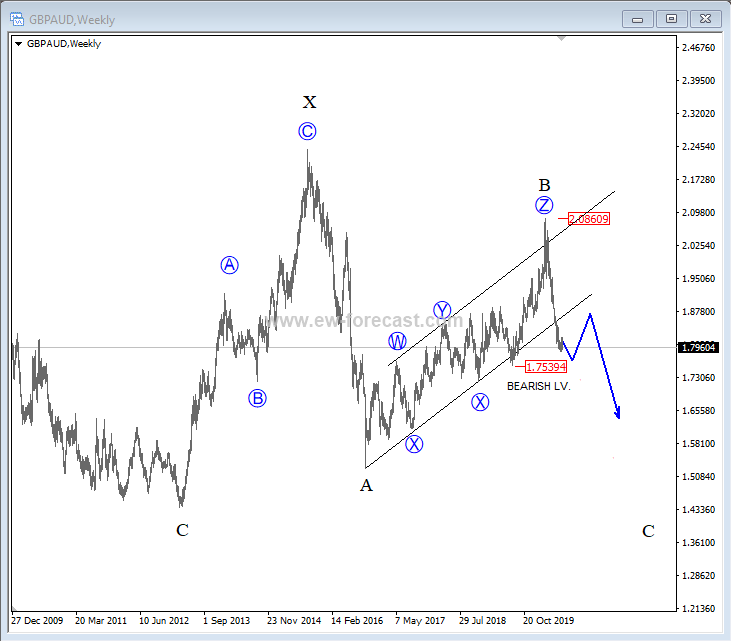
On the weekly chart of GBPAUD we see price declining sharply from 2.08 high, after a very long but choppy upward movement that was in play for almost 4 years, labelled as a corrective wave B.
We see price now declining and breaking below the lower corrective channel line, which is evidence that further weakness may be seen, especially as drop is unfolding impulsively.
GBPAUD, weekly
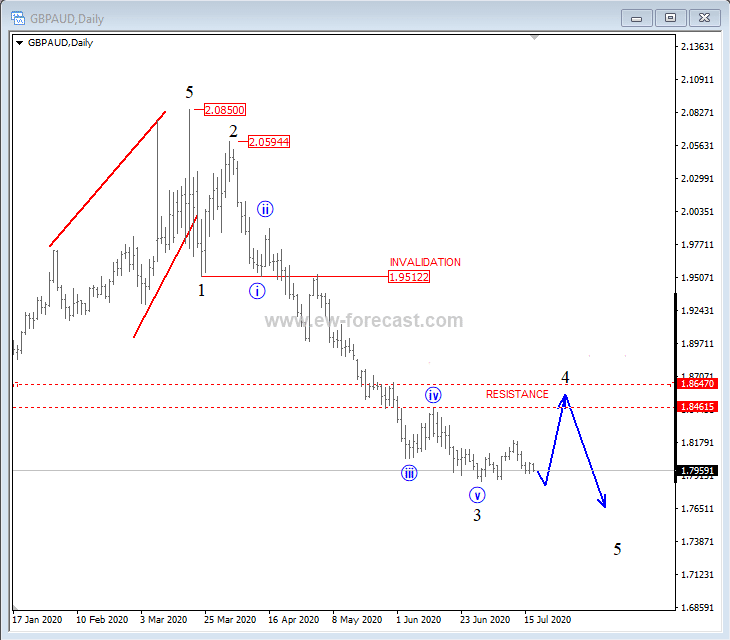
So when looking at a daily chart we expect to see a five wave drop, but that is not the case yet, so more weakness may come after a short-term rally up into wave 4 that can stop at 1.846 or maybe even at 1.87/1.88 resistance area.
GBPAUD, daily