GBP/USD showed strong upward movement, but closed the week with modest gains. The pair closed the week slightly below the 1.42 line. This week’s highlights are Average Earnings Index, Claimant Count Change and Retail Sales. Here is an outlook on the major events moving the pound and an updated technical analysis for GBP/USD.
In the UK, CPI posted a stronger gain than expected, raising speculation about a rate hike. Over in the US, both retail sales and inflation reports missed expectations, which has likely ruled out an April rate hike by the Federal Reserve. As well, consumer confidence numbers were well short of the estimate.
Updates:
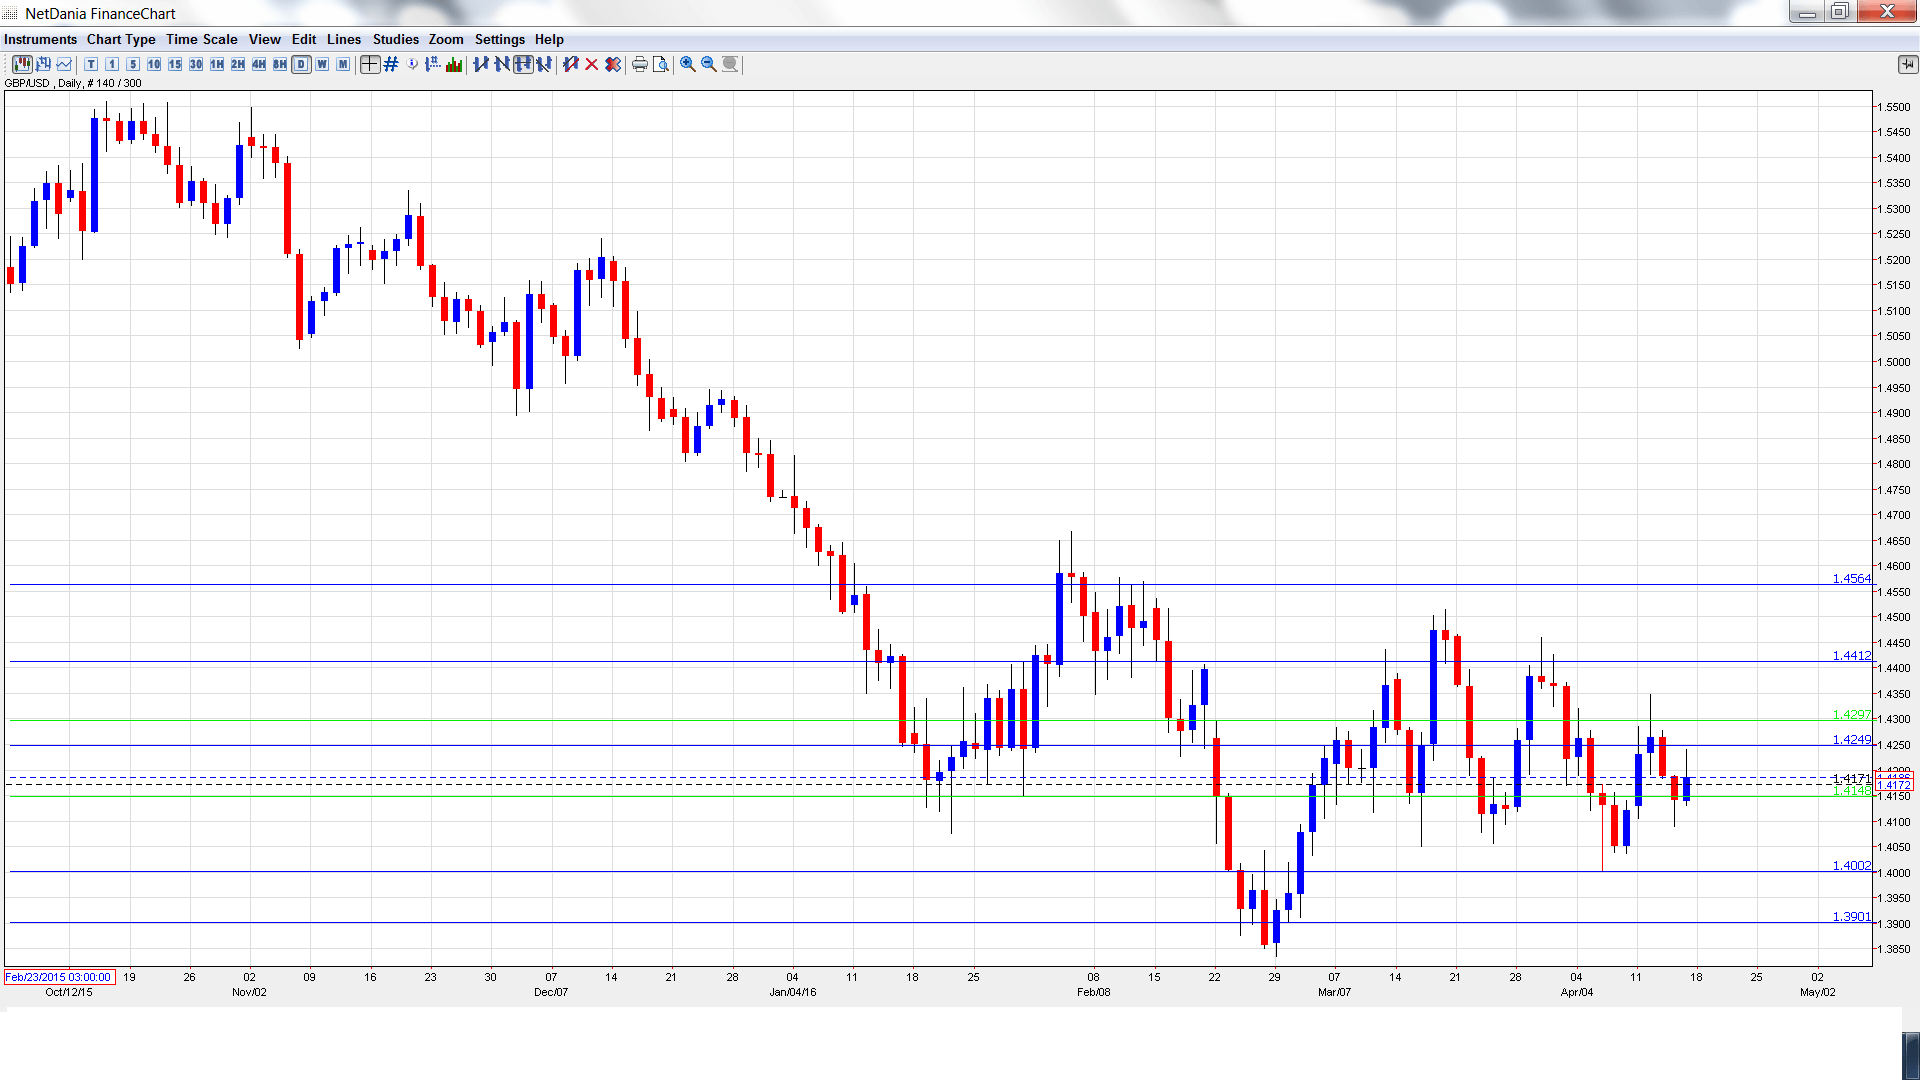
GBP/USD graph with support and resistance lines on it. Click to enlarge:
- Rightmove HPI: Sunday, 23:01. This housing inflation index provides a snapshot of the level of activity in the housing sector. The index came in at 1.3% in March, marking a third monthly gain.
- BOE Governor Mark Carney Speaks: Tuesday, 14:35. Carney will testify at the Lords Economic Affairs Committee in London. This event should be treated as a market-mover.
- Average Earnings Index: Wednesday, 8:30. This consumer inflation indicator improved to 2.1% in January, edging above the forecast of 2.0%. Another reading of 2.1% is expected in the February report.
- Claimant Count Change: Wednesday, 8:30. The indicator sparkled in February, posting a decline of 18.0 thousand. This was much stronger than the estimate of -8.8 thousand. Another decline is expected in March, with the estimate standing at -11.9 thousand. The unemployment rate is expected to remain at 5.1%, where it has hovered for the past three months.
- Retail Sales: Thursday, 8:30. Retail Sales is the primary gauge of consumer spending, a key engine of economic growth. The indicator slipped to -0.4% in February, but this beat the forecast of -0.7%. The March release stands at -0.1%.
- Public Sector Net Borrowing: Thursday, 8:30. The UK posted a deficit of GBP 6.5 billion in February, higher than the estimate of GBP 5.4 billion. The deficit is expected to narrow to GBP 5.6 billion in March.
* All times are GMT
GBP/USD Technical Analysis
GBP/USD opened the week at 1.4129. The pair quickly climbed to a high of 1.4348, testing resistance at 1.4297(discussed last week). The pair then reversed directions and dropped to a low of 1.4089. GBP/USD closed at the week at 1.4186.
Live chart of GBP/USD: [do action=”tradingviews” pair=”GBPUSD” interval=”60″/]
Technical lines from top to bottom
1.4562 is providing strong resistance.
1.4413 was a cap in January.
1.4297 was tested in resistance for a second straight week
1.4148 was tested in support and is a weak line. The line was a cushion in late January.
The round number of 1.40 continues to provide support. It was last breached in March.
1.3901 is providing support just above the 1.39 level.
1.3809 has held firm since March 2009.
1.3678 is the final support line for now.
I am neutral on GBP/USD.
With the markets unsure of the monetary plans of the BoE and the Fed, the dollar has lost its divergence advantage, at least for now. The Doha oil meeting could be a big disappointment, which could lead to lower oil prices. This could push more investors towards the safe-haven US dollar.
In our latest podcast go on a Euro-trip
Follow us on Sticher or on iTunes
Further reading:
- For a broad view of all the week’s major events worldwide, read the USD outlook.
- For EUR/USD, check out the Euro to Dollar forecast.
- For the Japanese yen, read the USD/JPY forecast.
- For the kiwi, see the NZD/USD forecast.
- For the Australian dollar (Aussie), check out the AUD to USD forecast.
- For the Canadian dollar (loonie), check out the USD to CAD forecast.
