GBP/USD posted sharp gains last week, gaining 160 points. The pair closed at 1.3069. This week’s key event is Second Estimate GDP. Here is an outlook on the major market-movers and an updated technical analysis for GBP/USD.
The pound was buoyed by surprisingly strong British numbers in July. CPI, employment and retail sales all beat their estimates, despite widespread fears of a post-Brexit collapse. In the US, the Fed’s minutes showed that only a small minority favors a rate hike, while the vast majority wants to continue to wait, notably because of low inflation levels.
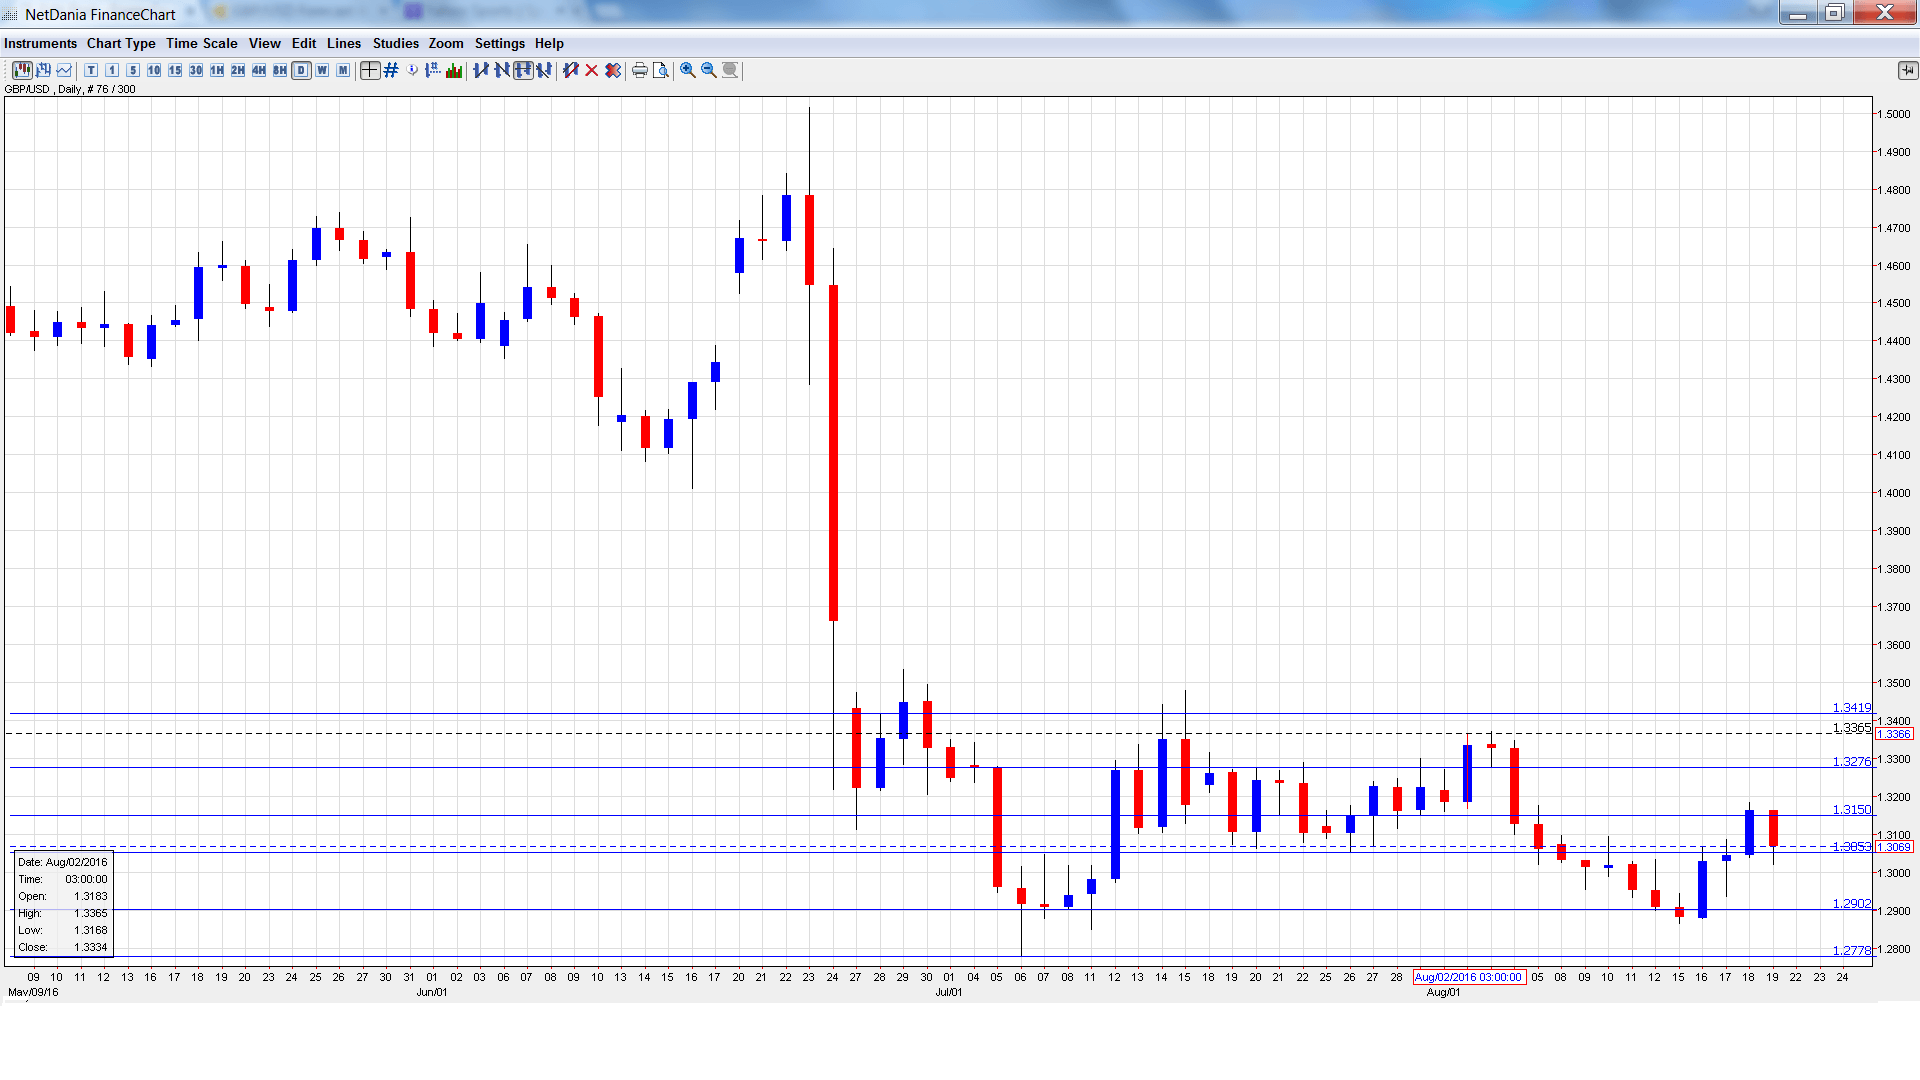
[do action=”autoupdate” tag=”GBPUSDUpdate”/]GBP/USD graph with support and resistance lines on it. Click to enlarge:
- CBI Industrial Order Expectations: Sunday, 10:00. Manufacturers remain pessimistic the UK manufacturing sector, as the indicator continues to reel off negative readings. The indicator came in at minus -4 in July, within expectations. However, August could be rocky, with an estimate of minus -9.
- BBA Mortgage Approvals: Wednesday, 8:30. This indicator provides a snapshot of the level of activity in the housing industry. In June, the indicator dipped to 40.1 thousand, very close to the estimate. The downward trend is expected to continue, with an estimate of 38.5 thousand.
- CBI Realized Sales: Thursday, 10:00. Retailers and wholesalers were in a sour mood after the Brexit referendum vote, as the indicator plunged, with a reading of minus -14. This marked the lowest reading since January 2012. The August reading is expected to show another decline, with an estimate of minus -4.
- Second Estimate GDP: Friday, 8:30. GDP is one of the most important indicators and should be treated as a market -mover. Preliminary GDP for Q2 came in at 0.6%, and the estimate for Second Estimate GDP also stands at 0.6%. Another solid GDP reading could boost the British pound.
- Preliminary Business Investment: Friday, 8:30. Capital investment has been pointing lower with two straight declines. The Q1 order dipped 0.5%, surprising the markets which had expected a gain of 3.2%. The downward trend is expected to continue in Q2, with an estimate of -0.9%.
* All times are GMT
GBP/USD Technical Analysis
GBP/USD opened the week at 1.2908 and quickly touched a low of 1.2865. The pair then reversed directions and climbed to a high of 1.3185, testing resistance at 1.3149 (discussed last week). GBP/USD retracted late in the week, closing the week at 1.3069.
Live chart of GBP/USD: [do action=”tradingviews” pair=”GBPUSD” interval=”60″/]
Technical lines from top to bottom
We start at 1.3419, which has held as resistance since mid-July.
1.3276 is next.
1.3149 was tested during the week as GBP/USD showed some strength.
1.3053 has switched to a support role. It is a weak line and could see further action early in the week.
1.2902 has strengthened in support.
1.2778 was a cushion in mid-July.
1.2680 is the final support level for now.
I am bearish on GBP/USD.
Despite some strong data last week, the UK economy has likely taken a hit from Brexit and will be hard-pressed to continue churning out positive numbers. In the US, despite some recent weak data, a December hike remains 50/50, so any strong numbers will boost the odds of rate hike and could push the dollar higher.
Our latest podcast is all about the Fed’s forecast failures.
Follow us on Sticher or iTunes
Further reading:
- For a broad view of all the week’s major events worldwide, read the USD outlook.
- For EUR/USD, check out the Euro to Dollar forecast.
- For the Japanese yen, read the USD/JPY forecast.
- For the kiwi, see the NZD/USD forecast.
- For the Australian dollar (Aussie), check out the AUD to USD forecast.
- For the Canadian dollar (loonie), check out the USD to CAD forecast.
