GBP/USD closed the week unchanged, at 1.2475. This week’s key events are Claimant Count Change and CPI. Here is an outlook for the highlights of this week and an updated technical analysis for GBP/USD.
US numbers were mixed, as unemployment claims dropped and beat expectations. However, UoM Consumer Sentiment fell to a 3-month low, and missed the estimate. In the UK, Manufacturing Production surged 2.1%, well above the forecast of 0.3%.
[do action=”autoupdate” tag=”GBPUSDUpdate”/]GBP/USD graph with support and resistance lines on it. Click to enlarge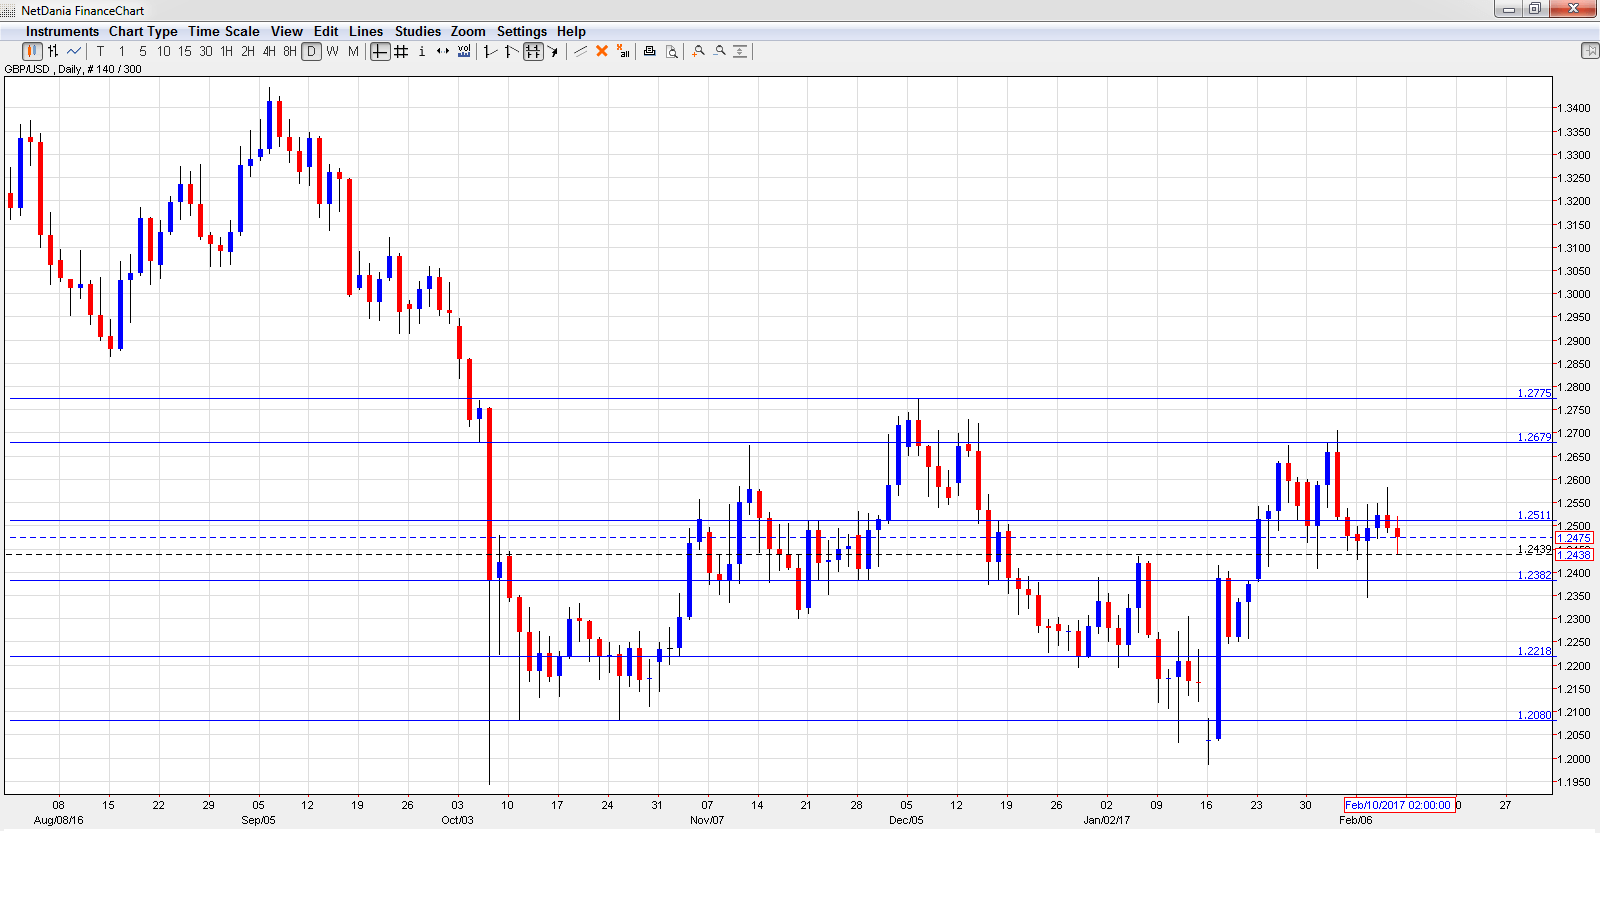
- CPI: Tuesday, 9:30. CPI is the most important inflation indicator and should be treated as a market-mover. The index continues to rise and came in at 1.6% in December, above the forecast of 1.4%. The upward swing is expected to continue, with an estimate of 1.9%.
- PPI Input: Tuesday, 9:30. This indicator measures inflation in the manufacturing sector. The index rebounded in December with a strong gain of 1.8%, but this was short of the forecast of 2.2%. The estimate for the January report is 1.0%
- RPI Input: Tuesday, 9:30. RPI includes housing costs, which are excluded from CPI. In December, the index, rose to 2.5%, above the estimate of 2.3%. The upward swing in expected to continue, with an estimate of 2.8%.
- Average Earnings Index: Wednesday, 9:30. Wage growth rose to 2.8% in November, above the forecast of 2.6%. Another gain of 2.8% is expected in the December release.
- Claimant Count Change: Wednesday, 9:30. This is one of the most important indicators and an unexpected reading can have a significant effect on the movement of GBP/USD. The indicator sparkled with a reading of -10.1 thousand in December, compared to an estimate of 4.6 thousand. A small gain of 1.1 thousand is expected in January.
- CB Leading Index: Wednesday, 14:30. This minor index has been steady and edged down to 0.0% in November.
- Retail Sales: Friday, 9:30. Retail Sales is the primary gauge of consumer spending and should be treated as a market-mover. In December, the indicator declined sharply, with a reading of -1.9%. This was much weaker than the forecast of -0.1%. Will the indicator rebound in January?
* All times are GMT
GBP/USD Technical Analysis
GBP/USD opened the week at 1.2482 and dropped to a low of 1.2345, testing support at 1.2385 (discussed last week). The pair then reversed directions and climbed to a high of 1.2582. GBP/USD was unable to consolidate at this level and closed at 1.2475.
Live chart of GBP/USD:
Technical lines from top to bottom
We begin with resistance at 1.2860.
1.2775 was a high point in December 2016.
1.2674 was a cap in November.
1.2511 was tested last week and remains a weak resistance line.
1.2385 is providing support.
1.2218 is next.
1.2080 is protecting the symbolic 1.20 level. It is the final support line for now.
I am bearish on GBP/USD.
The US economy remains in good shape, but Donald Trump’s theatrics and lack of an economic plan have led to uneasiness in the markets. In the UK, the BoE appears in no rush to raise rates, even with inflation moving higher.
Our latest podcast is titled Oil upside and euro underperformance
Follow us on Sticher or iTunes
Further reading:
- For a broad view of all the week’s major events worldwide, read the USD outlook.
- For EUR/USD, check out the Euro to Dollar forecast.
- For the Japanese yen, read the USD/JPY forecast.
- For the kiwi, see the NZD/USD forecast.
- For the Australian dollar (Aussie), check out the AUD to USD forecast.
- For the Canadian dollar (loonie), check out the USD to CAD forecast.
