GBP/USD posted moderate losses last week, closing just above the 1.24 line. This week’s key event is Second Estimate GDP. Here is an outlook for the highlights of this week and an updated technical analysis for GBP/USD.
It was a positive week in the US, as retail sales and CPI beat expectations and Fed Chair Yellen sounded upbeat about the US economy. In the UK, CPI rose to 1.8%, shy of the forecast of 1.9%. Employment data was mixed, as unemployment rolls plunged while wages dipped lower.
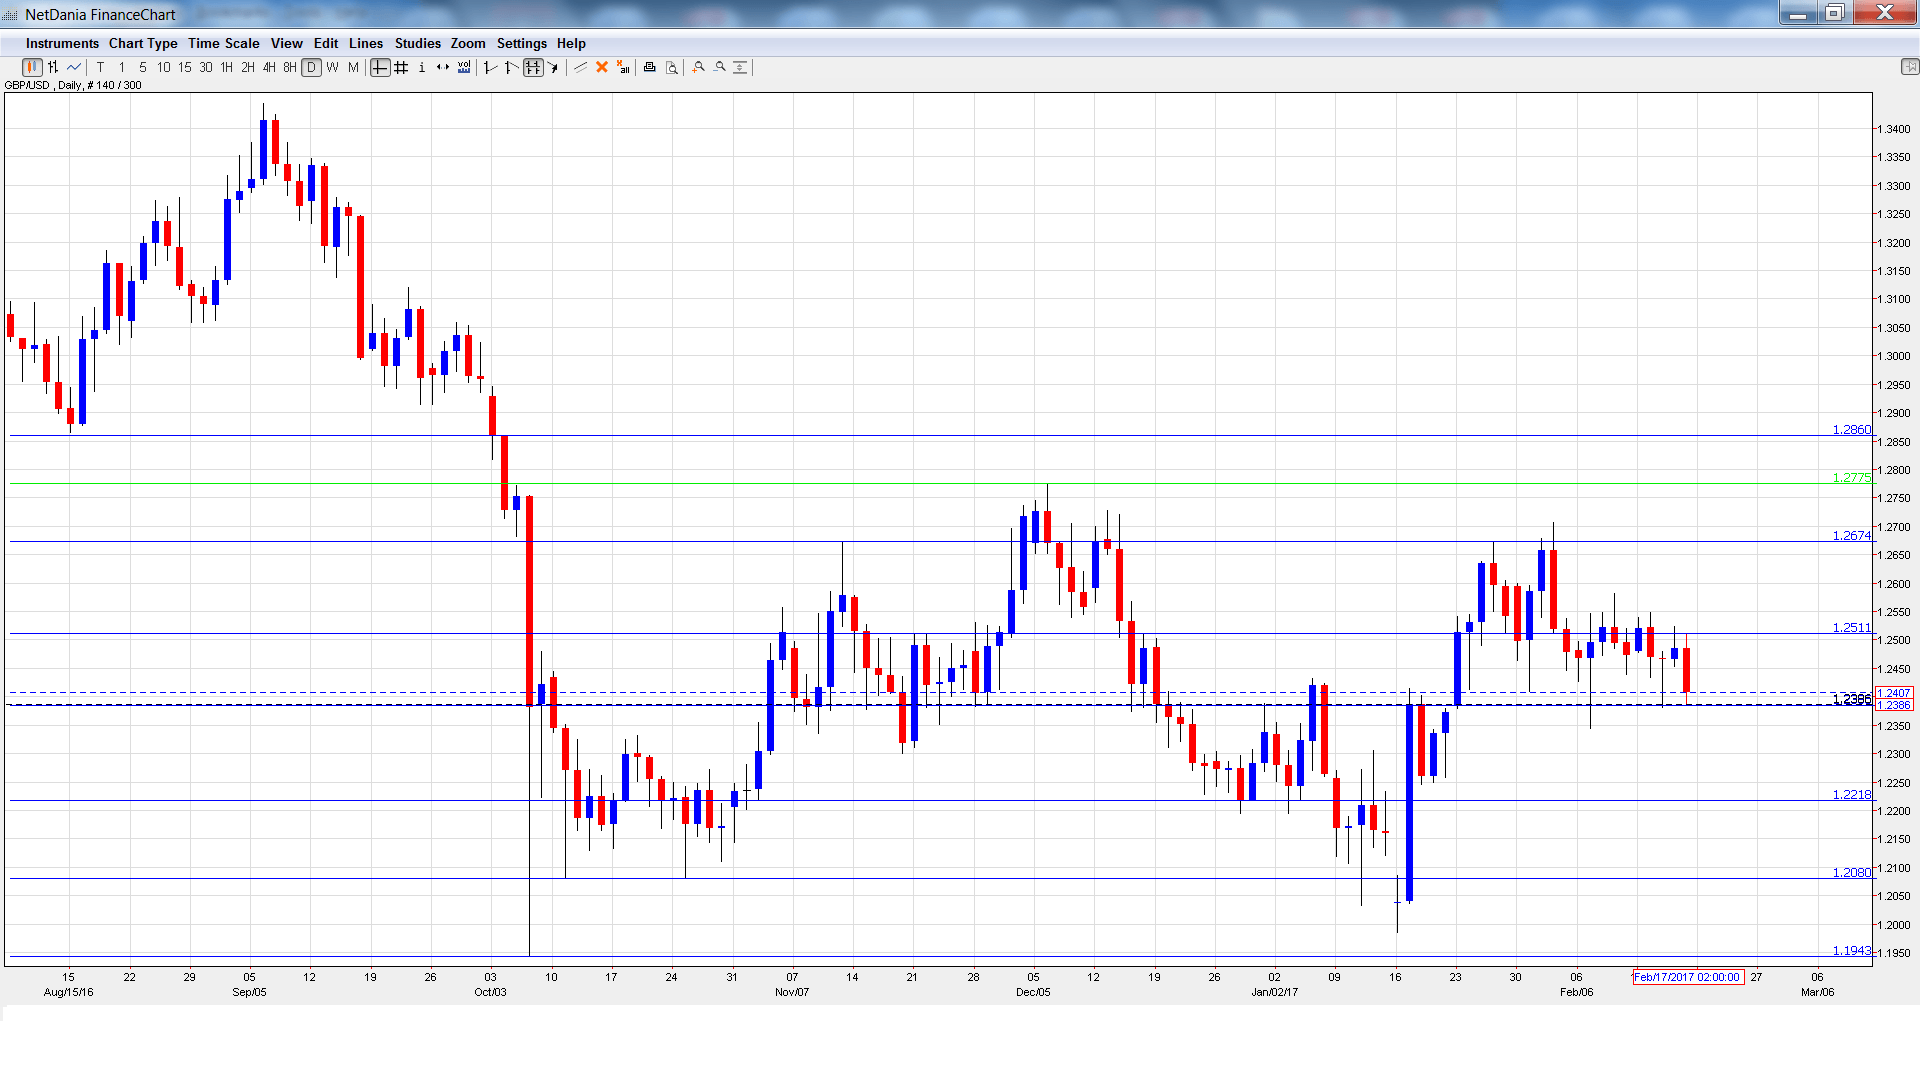
[do action=”autoupdate” tag=”GBPUSDUpdate”/]GBP/USD graph with support and resistance lines on it. Click to enlarge:
- Rightmove HPI: Monday, 00:01. This indicator provides a snapshot of the level of activity in the housing sector. The indicator rebounded in January after two straight declines, posting a gain of 0.4%.
- CBI Industrial Order Expectations: Monday, 11:00. The indicator continues to point upwards, and improved to 5 points in January, beating the estimate of 2 points. The markets are forecasting a gain of 5 points in the February report.
- Public Sector Net Borrowing: Tuesday, 9:30. The UK’s budget deficit narrowed to GBP 6.4 billion in December, better than the estimate of GBP 6.7 billion. The markets are expecting a large surplus in the January report, with an estimate of -14.4 billion.
- Second Estimate GDP: Wednesday, 9:30. GDP reports should be treated as market-movers, and an unexpected reading could have a significant impact on the movement of GBP/USD. Preliminary GDP posted a gain of 0.6% in Q4, edging above the estimate of 0.5%. The forecast for Second Estimate GDP stands at 0.5%.
- Preliminary Business Investment: Wednesday, 9:30. The indicator continues to point upward and posted a gain of 0.9% in the third quarter. This easily beat the estimate of -0.2%. The markets are expecting a weak reading of 0.0% in Q4.
- 10-y Bond Auction: Thursday, Tentative. In the January auction, the yield on 10-year bonds improved to 1.45%, its highest level since May 2016.
- CBI Realized Sales: Thursday, 11:00. The indicator moved higher in Q4, but plunged in January with a reading of -8 points. This was much worse than the estimate of +28 points. The markets are forecasting better news for January, with an estimate of +5 points.
- BBA Mortgage Approvals: Friday, 9:30. The indicator was up significantly in December, climbing to 43.2 thousand. This beat the forecast of 41.1 thousand. The estimate for January stands at 41.9 thousand.
* All times are GMT
GBP/USD Technical Analysis
GBP/USD opened the week at 1.2480 and touched a high of 1.2548. The pair then reversed directions and dropped to a low of 1.2382, testing support at 1.2385 (discussed last week). GBP/USD closed the week at 1.2407.
Live chart of GBP/USD:
Technical lines from top to bottom
We begin with resistance at 1.2860.
1.2775 was a high point in December 2016.
1.2674 was a cap in November.
1.2511 has some breathing room in resistance following losses by GBP/USD last week.
1.2385 was tested in support for a second straight week. It is currently a weak line.
1.2218 is next.
1.2080 is protecting the symbolic 1.20 level.
1.1943 is the final support line for now.
I am bearish on GBP/USD.
Janet Yellen presented lawmakers with a positive assessment of the US economy, and strongly hinted that another rate hike is coming in the first half of 2017. In the UK, the BoE appears in no rush to raise rates, even with inflation moving higher. So, monetary divergence favors the greenback.
Our latest podcast is titled Oil upside and euro underperformance
Follow us on Sticher or iTunes
Further reading:
- For a broad view of all the week’s major events worldwide, read the USD outlook.
- For EUR/USD, check out the Euro to Dollar forecast.
- For the Japanese yen, read the USD/JPY forecast.
- For the kiwi, see the NZD/USD forecast.
- For the Australian dollar (Aussie), check out the AUD to USD forecast.
- For the Canadian dollar (loonie), check out the USD to CAD forecast.
