GBP/USD soared last week, gaining 340 points. The pair closed at 1.2373. This week’s key event is Preliminary GDP. Here is an outlook for the highlights of this week and an updated technical analysis for GBP/USD.
The pound posted its highest single-day gain since 2008 after Prime Minister May’s Brexit speech. May said the UK would leave the EU single market but was interested in a free-trade agreement with continent. In the US, manufacturing and employment numbers were solid and beat expectations. Philly Fed Manufacturing Index continued to climb higher and unemployment claims beat expectations for a fourth straight week.
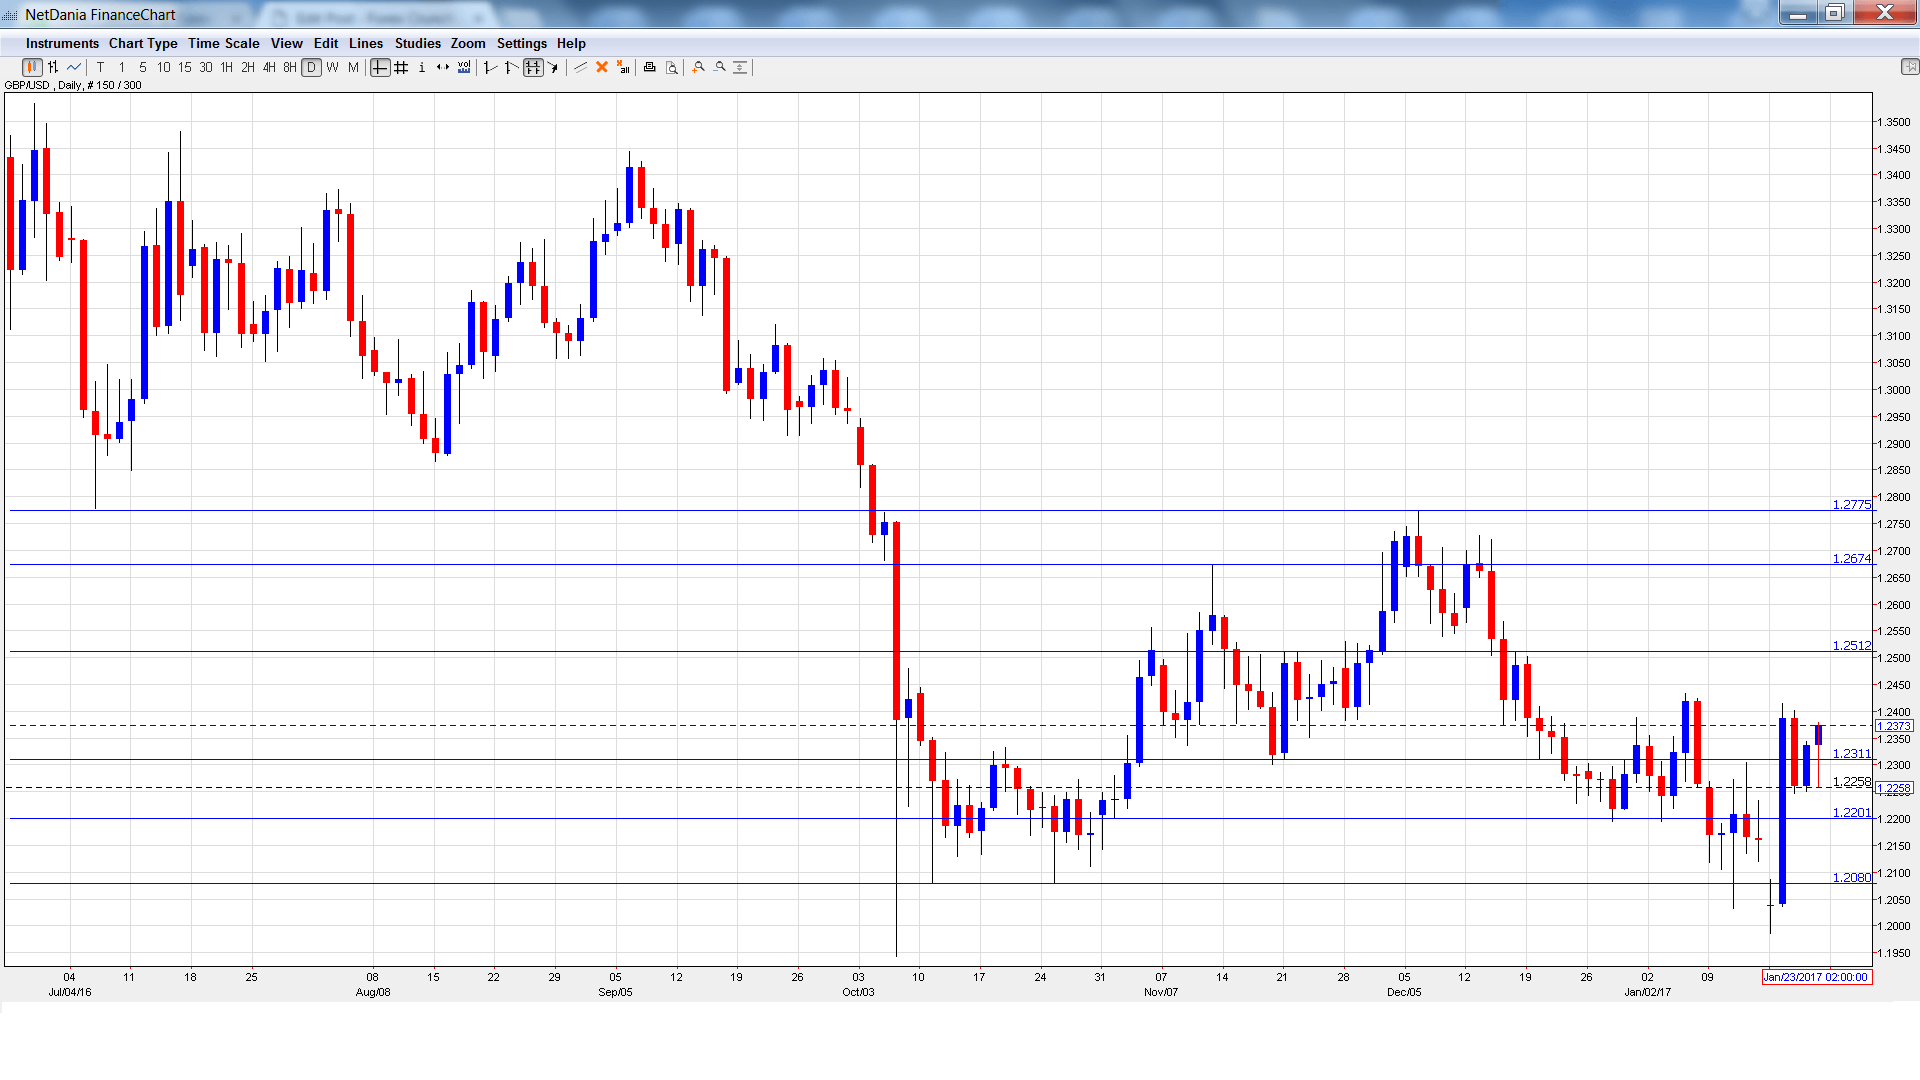
[do action=”autoupdate” tag=”GBPUSDUpdate”/]GBP/USD graph with support and resistance lines on it. Click to enlarge:
- EU Membership Court Ruling: Tuesday, 9:30. The UK Supreme Court will announce its decision as to whether the government can trigger Article 50 and initiate Brexit without parliament’s approval. We could see some volatility from the pound after the Court’s ruling.
- Public Sector Net Borrowing: Tuesday, 9:30. The UK’s budget deficit ballooned to GBP 12.2 billion in November, higher than the forecast of GBP 11.5 billion. The deficit is expected to narrow to GBP 6.7 billion in December.
- CBI Industrial Order Expectations: Wednesday, 11:00. The indicator improved to a flat reading of zero in December, following a string of declines dating back to April 2015. The upward trend is expected to grow, with an estimate of 2 points.
- Preliminary GDP: Thursday, 9:30. This is the key event of the week and should be treated as a market-mover. Final GDP for Q4 in 2016 posted a gain of 0.6%, edging above the estimate of 0.5%. Preliminary GDP for Q1 in 2017 stands at 0.5%.
- CBI Realized Sales: Thursday, 11:00. The indicator continues to move higher and rose to 35 points in December, well above the forecast of 20 points. The estimate for the January report stands at 28 points.
* All times are GMT
GBP/USD Technical Analysis
GBP/USD opened the week at 1.2036 and quickly dropped to a low of 1.1985, testing resistance at 1.2201. The pair then reversed directions and climbed to a high of 1.2415, as resistance held at 1.2433 (discussed last week). GBP/USD closed the week at 1.2373.
Live chart of GBP/USD:
Technical lines from top to bottom
With GBP/USD posting sharp gains, we start at higher levels:
1.2775 was a high point in December 2016.
1.2674 was a cap in November.
1.2512 has switched to a resistance role. It is a weak line.
1.2311 is an immediate support line.
1.2201 switched to support after GBP/USD made sharp gains early in the week.
1.2080 is protecting the symbolic 1.20 level.
1.1943 has provided support since October 2016. It is the final support line for now.
I am bearish on GBP/USD.
There are concerns as Donald Trump takes over as president, as his economic policies remain unclear. However, the economy is strong and if inflation levels move higher, we could see the Fed step in with additional rate hikes. In the UK, concerns over Brexit could weigh on the pound.
Our latest podcast is titled Monetary Matters – FED, ECB and BOE movements
Follow us on Sticher or iTunes
Further reading:
- For a broad view of all the week’s major events worldwide, read the USD outlook.
- For EUR/USD, check out the Euro to Dollar forecast.
- For the Japanese yen, read the USD/JPY forecast.
- For the kiwi, see the NZD/USD forecast.
- For the Australian dollar (Aussie), check out the AUD to USD forecast.
- For the Canadian dollar (loonie), check out the USD to CAD forecast.
