GBP/USD dropped 110 points last week, closing at 1.2290. This week’s key events are the Annual Budget and Manufacturing Production. Here is an outlook for the highlights of this week and an updated technical analysis for GBP/USD.
In the US, Donald Trump’s speech was short on specifics, disappointing the markets. Still, hawkish comments from Dudley and then from Brainard have sharply raised expectations of a March hike. In the UK, Manufacturing PMI dropped for a second straight month, while Services PMI missed expectations.
Updates:
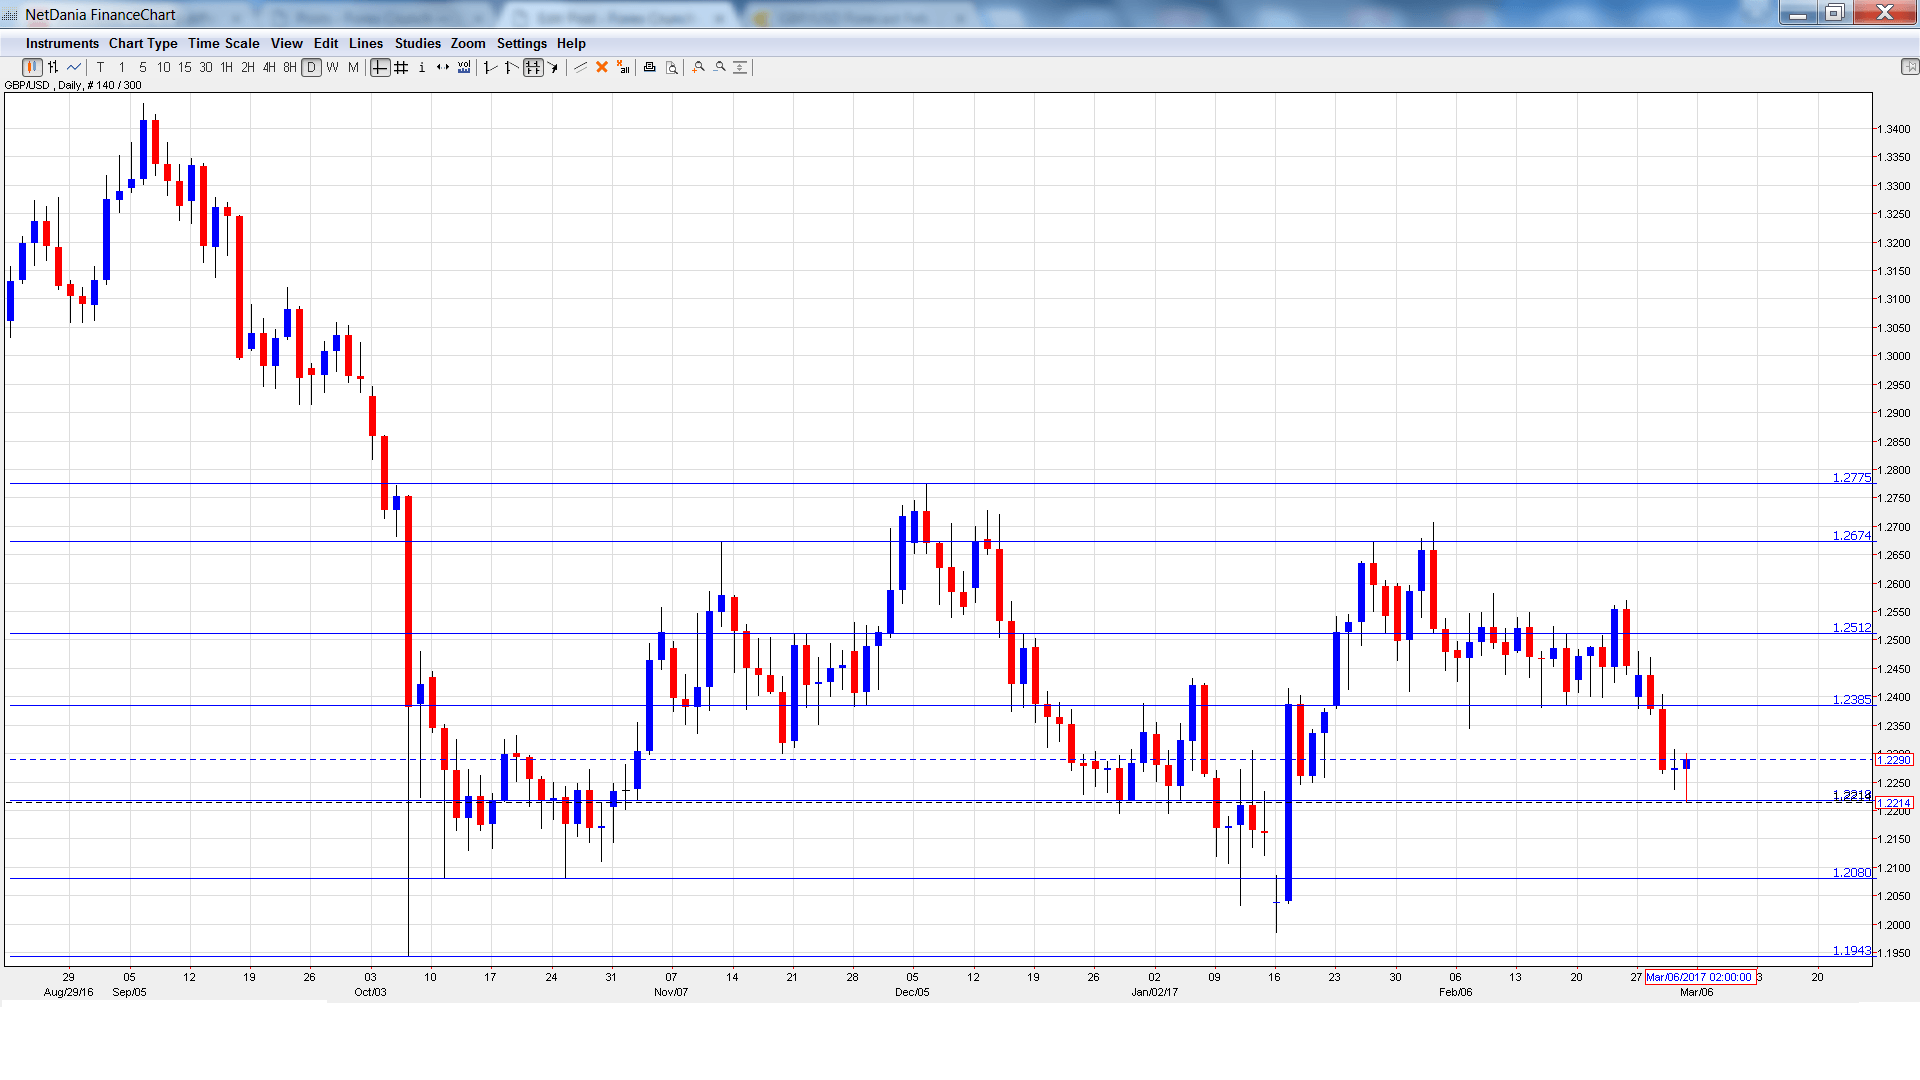
GBP/USD graph with support and resistance lines on it. Click to enlarge:
- BoE Deputy Governor Charlotte Hogg Speech: Tuesday, 11:30. The newest member of the MPC will deliver remarks at an event in Lincoln. The markets will be all ears, looking for clues regarding any change to the BoE’s neutral monetary stance.
- BRC Retail Sales Monitor: Tuesday, 00:01. This indicator measures retail sales in BRC shops. The index was unexpectedly soft with a reading of -0.6%, its first decline in 5 months.
- Halifax HPI: Wednesday, 8:30. This inflation index provides a snapshot of the strength of the housing sector. In January, the index declined 0.9%, well off the forecast of +0.2%. The markets are expecting a rebound in the February report, with an estimate of 0.4%.
- Annual Budget Release: Wednesday, 12:30.The annual budget provides details of the government’s projected spending, borrowing and revenue levels. Traders should treat it as a market-mover.
- RICS House Price Balance: Thursday, 00:01. This housing indicator was almost unchanged at 25% in January, within expectations. The estimate for February is 23%.
- Manufacturing Production: Friday, 9:30. This key indicator jumped to 2.1% in December, crushing the estimate of 0.3%. The markets are braced for a decline of 0.6% in the January report.
- Goods Trade Balance: Friday, 9:30.The UK trade deficit narrowed to GBP 10.9 billion in December, smaller than the estimate of GBP 11.5 billion. In January, the deficit is expected to rise slightly to GBP 11.1 billion.
- NIESR GDP Estimate: Friday, 15:00. This monthly indicator helps analysts track GDP releases, which are released every quarter. The indicator jumped to 0.7% in January, its highest level since July 2015.
* All times are GMT
GBP/USD Technical Analysis
GBP/USD opened the week at 1.2399 and quickly climbed to 1.2479, as resistance held firm at 1.2511 (discussed last week). The pair reversed directions and dropped to a low of 1.2214, but recovered to close the week at 1.2290.
Live chart of GBP/USD:
Technical lines from top to bottom
We start with resistance at 1.2775. This line was a high point in December 2016.
1.2674 was a cap in November.
1.2511 held firm last week as the pair posted gains before retracting.
1.2385 is next.
1.2218 is an immediate support level.
1.2080 is protecting the symbolic 1.20 level.
1.1943 is the final support line for now.
I am bearish on GBP/USD.
The Trump administration’s first month in office has been beset by difficulties and Trump’s economic agenda remains unclear. Still the US economy is doing well and growing optimism over a March rate hike is bullish for the US dollar.
Our latest podcast is titled Fed refocus as monetary matters once again
Follow us on Sticher or iTunes
Safe trading!
Further reading:
- For a broad view of all the week’s major events worldwide, read the USD outlook.
- For EUR/USD, check out the Euro to Dollar forecast.
- For the Japanese yen, read the USD/JPY forecast.
- For the kiwi, see the NZD/USD forecast.
- For the Australian dollar (Aussie), check out the AUD to USD forecast.
- For the Canadian dollar (loonie), check out the USD to CAD forecast.
