GBP/USD edged higher last week, closing at 1.2454. This week’s key events are the PMI reports. Here is an outlook for the highlights of this week and an updated technical analysis for GBP/USD.
US numbers were respectable last week. The FOMC’s minutes were slightly dovish but still upbeat. Still, the dollar failed to gain ground as the the Trump administration is yet to outline its economic agenda. In the UK, Second Estimate GDP posted a gain of 0.7%, edging above the estimate of 0.6%. BoE Governor Carney testified before a parliamentary committee about the inflation report. Despite stronger inflation and decent economic numbers, the BoE is reluctant to raise rates, as it continues to maintain a neutral monetary policy stance.
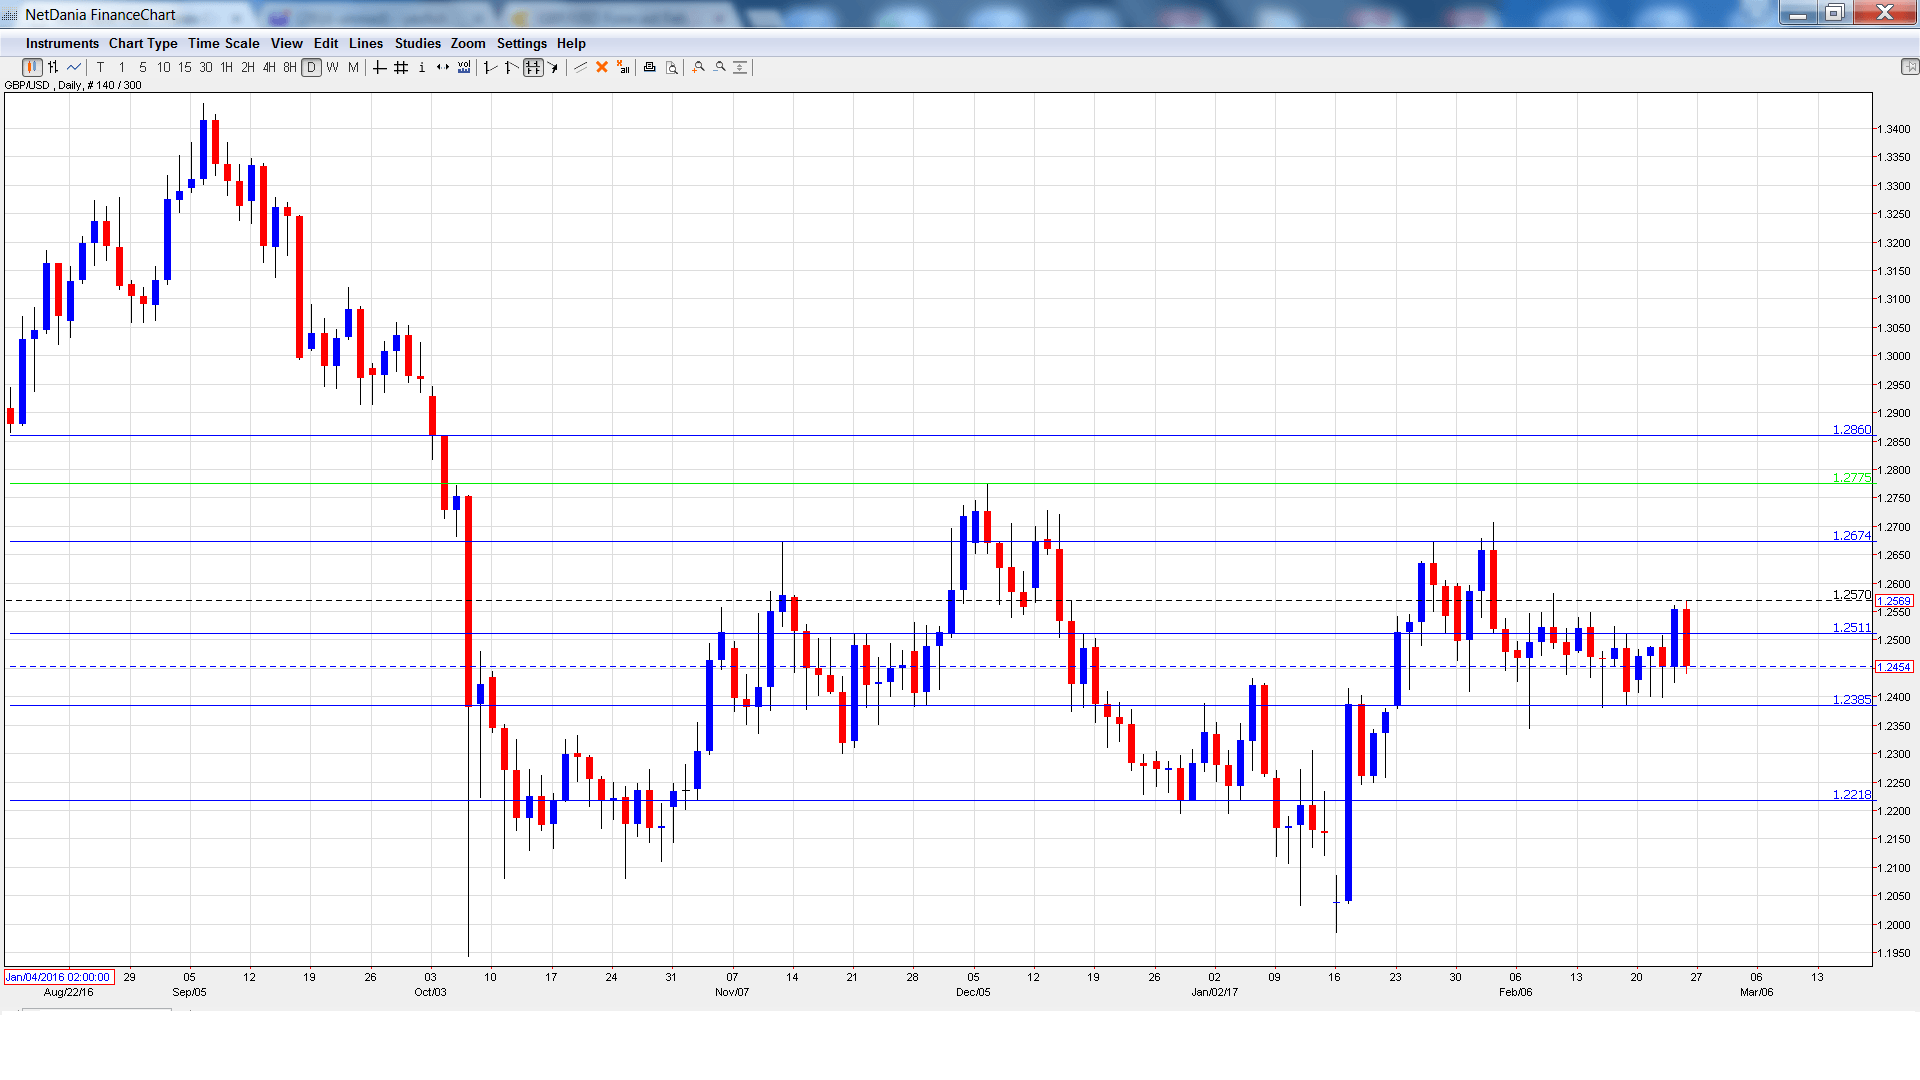
[do action=”autoupdate” tag=”GBPUSDUpdate”/]GBP/USD graph with support and resistance lines on it. Click to enlarge:
- GfK Consumer Confidence: Tuesday, 00:01. The index continues to pile up declines, pointing to ongoing pessimism. Little change is expected in the February line, with an estimate of -6 points.
- Nationwide HPI: Tuesday, 28th-2nd. This housing indicator gauges the strength of the housing sector. The indicator slipped to just 0.2% in January, above the estimate of 0.0%. Will the indicator rebound in the February report?
- BRC Shop Price Index: Wednesday, 00:01. This indicator is based on consumer inflation in BRC stores. The index has posted three readings of -1.7% in the past four months.
- Manufacturing PMI: Wednesday, 9:30. PMIs are important gauges of the strength of the economy. In January, the index showed little change with a reading of 55.9, matching the forecast. The estimate for February stands at 55.7 points.
- Net Lending to Individuals: Wednesday, 9:30. Borrowing levels are closely watched, as they are positively linked to spending levels. In December, the indicator dropped to GBP 4.8 million, short of the estimate of GBP 5.3 million. The downward trend is expected to continue, with an estimate of GBP 4.0 billion.
- Construction PMI: Thursday, 9:30. The PMI dropped to 52.2 points in January, missing the estimate of 53.9 points. This marked the indicator’s lowest level since August 2016. Little change is expected in the February report.
- Services PMI: Friday, 9:30. The PMI continues to show expansion. In January, the index dipped to 54.5, short of the estimate of 55.8 points. The indicator is expected to edge down to 54.2 in the February report.
* All times are GMT
GBP/USD Technical Analysis
GBP/USD opened the week at 1.2428 and dropped to a low of 1.2398, as support held at 1.2385 (discussed last week). Late in the week, the pair touched a high of 1.2570, but was unable to consolidate. GBP/USD closed the week at 1.2454.
Live chart of GBP/USD:
Technical lines from top to bottom
We start with resistance at 1.2860.
1.2775 was a high point in December 2016.
1.2674 was a cap in November.
1.2511 is a weak resistance line. It could see action early in the week.
1.2385 is an immediate support level.
1.2218 is next.
1.2080 is protecting the symbolic 1.20 level.
1.1943 is the final support line for now.
I am bearish on GBP/USD.
The markets remain concerned over Donald Trump, as his administration’s first month in office has been beset by crises and difficulties in filling key cabinet positions. Still the US economy is doing well and there is a strong likelihood of a rate hike in the first of 2017.
Our latest podcast is titled Fed refocus as monetary matters once again
Follow us on Sticher or iTunes
Safe trading!
Further reading:
- For a broad view of all the week’s major events worldwide, read the USD outlook.
- For EUR/USD, check out the Euro to Dollar forecast.
- For the Japanese yen, read the USD/JPY forecast.
- For the kiwi, see the NZD/USD forecast.
- For the Australian dollar (Aussie), check out the AUD to USD forecast.
- For the Canadian dollar (loonie), check out the USD to CAD forecast.
