GBP/USD posted strong gains last week, climbing 150 points. The pair closed the week just under the 1.45 line. This week’s key events are the PMI reports. Here is an outlook on the major events moving the pound and an updated technical analysis for GBP/USD.
The Fed meeting minutes were surprisingly hawkish, putting a June rate hike firmly on the table. US unemployment numbers were within expectations and housing numbers beat the estimate. British CPI and Claimant Change missed their estimates, but the pound shrugged off these releases.
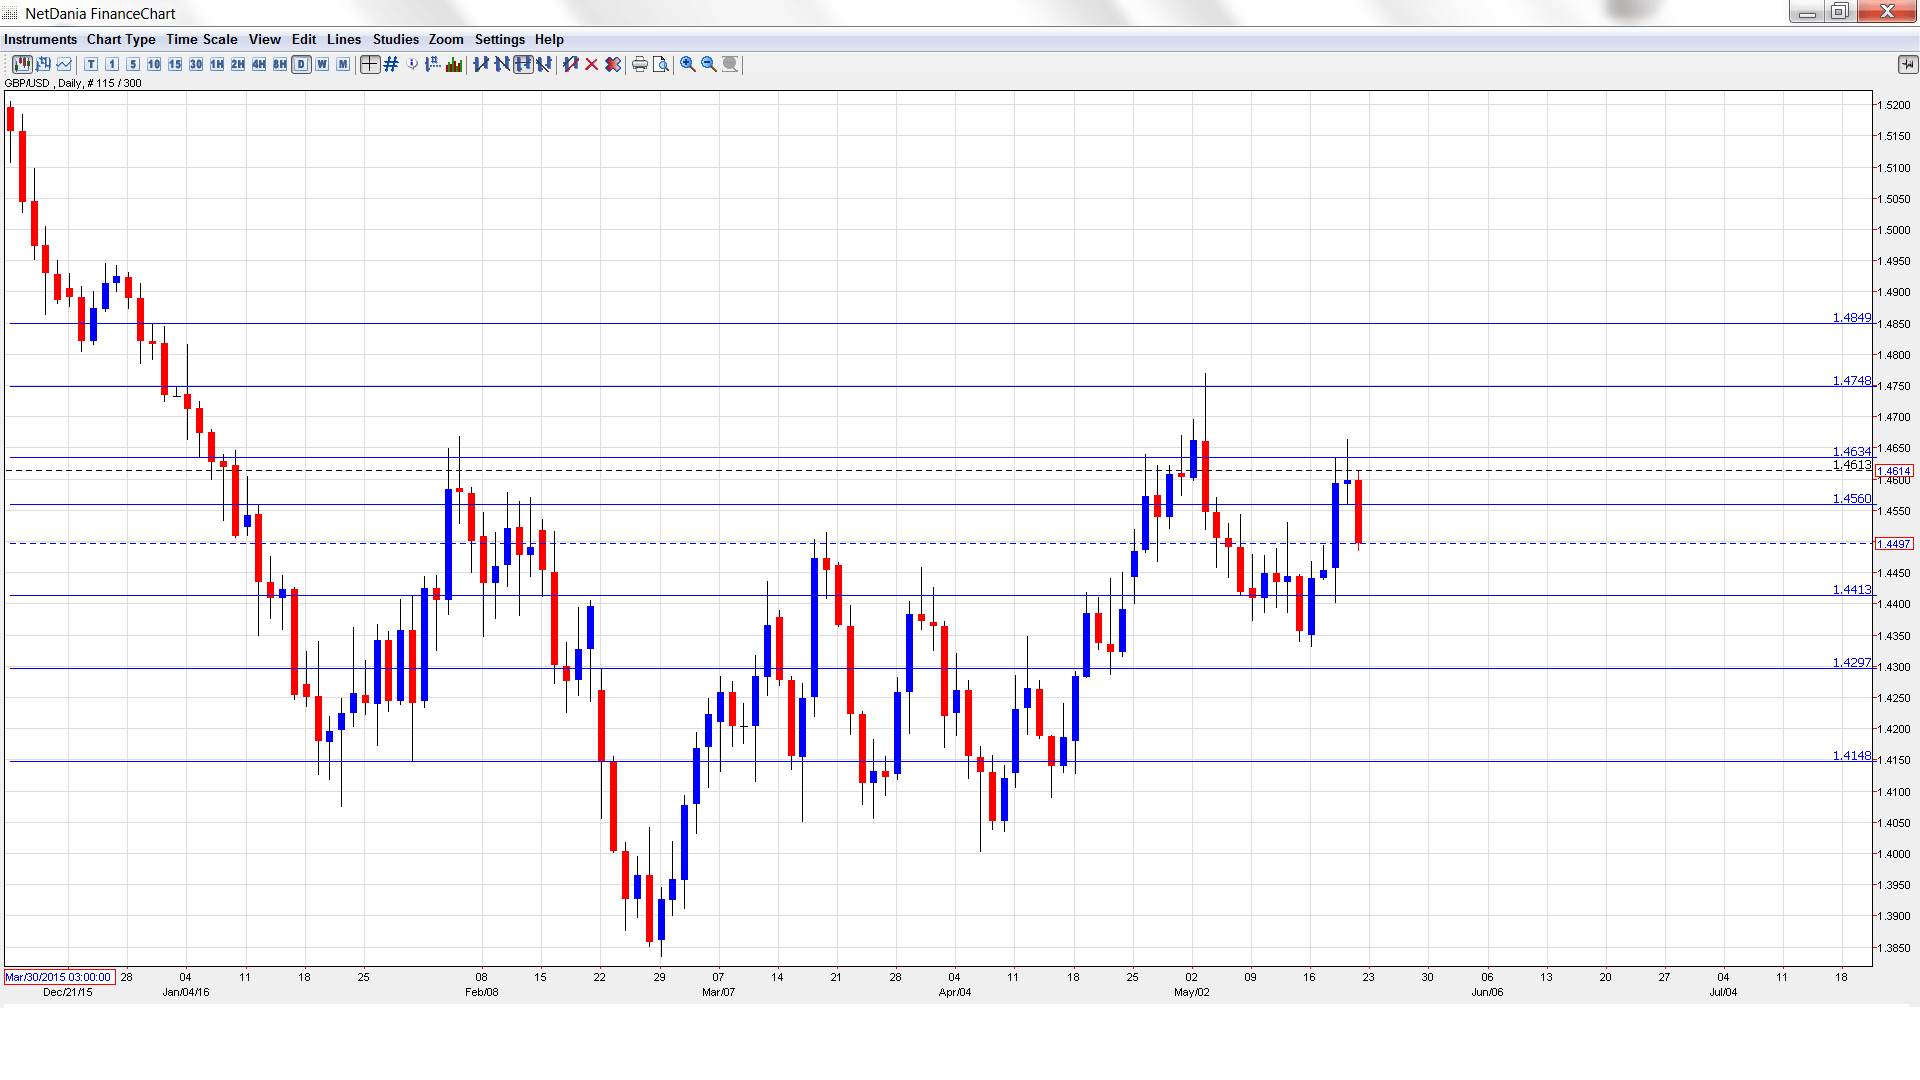
[do action=”autoupdate” tag=”GBPUSDUpdate”/]GBP/USD graph with support and resistance lines on it. Click to enlarge:
- BRC Shop Price Index: Tuesday, 23:01. This event helps analysts track consumer inflation. The index continues to post declines, with the past two releases coming in at -1.7%. Will we see an improvement in the April report?
- Nationwide HPI: Wednesday, 6:00. This indicator provides a snapshot of the level of activity in the UK housing sector. The index slipped to 0.2% in April, its weakest gain since November 2015. The estimate for the May report stands at 0.3%.
- Manufacturing PMI: Wednesday, 8:30. This is the first key event of the week. The PMI slipped to 49.2 points in March, indicating contraction for the first time in three years. The estimate for April is 49.6 points.
- Net Lending to Individuals: Wednesday, 8:30. An increase in borrowing levels by consumers often translates into higher consumer spending, a key driver of the economy. The indicator surged to GBP 9.3 billion in March, well above the forecast of GBP 5.0 billion. The estimate for the April report is GBP 5.3 billion.
- Construction PMI: Thursday, 8:30. Construction PMI dipped to 52.0 point in March, short of the forecast of 54.1 points. Little change is expected in the April report.
- Services PMI: Friday, 8:30. The indicator dropped to 52.3 points in March, its weakest gain in over three years. This figure was shy of the forecast of 53.6. An identical reading of 52.3 points is expected in April.
* All times are GMT
GBP/USD Technical Analysis
GBP/USD opened the week at 1.4350. The pair quickly dropped to a low of 1.4332 and then reversed directions. The pair climbed to a high of 1.4663, testing resistance at 1.4635 (discussed last week). GBP/USD closed the week at 1.4497.
Live chart of GBP/USD: [do action=”tradingviews” pair=”GBPUSD” interval=”60″/]
Technical lines from top to bottom
We begin with resistance at 1.4849.
1.4752 is next.
1.4635 has been a resistance line since early February. It held firm last week as GBP/USD posted strong gains.
1.4562 is a weak resistance line. It could see further action early in the week.
1.4413 was a cap in January. It is an immediate support line.
1.4297 is protecting the 1.43 line.
1.4148 is next.
1.4038 is the final support level for now.
I am bearish on GBP/USD.
With the Fed weighing a rate hike in June, monetary divergence will favor the US dollar. As well, the Brexit referendum continues to cause uncertainty in the UK, which is weighing on cable.
In our latest podcast we talk stocks, oil and preview the big week.
Follow us on Sticher or on iTunes
Further reading:
- For a broad view of all the week’s major events worldwide, read the USD outlook.
- For EUR/USD, check out the Euro to Dollar forecast.
- For the Japanese yen, read the USD/JPY forecast.
- For the kiwi, see the NZD/USD forecast.
- For the Australian dollar (Aussie), check out the AUD to USD forecast.
- For the Canadian dollar (loonie), check out the USD to CAD forecast.
