GBP/USD plunged last week, as the pair dropped 500 points and closed at 1.2422. The pair briefly dropped below the symbolic 1.20 level before reversing directions. It’s a very quiet week, with just three events on the schedule. Here is an outlook on the major market-movers and an updated technical analysis for GBP/USD.
GBP/USD experienced a “flash crash” on Thursday, sending the pound to a new 31-year low of 1.1943. On the release front, British numbers were positive. All three PMI reports were better than expected and Manufacturing Production posted a small gain, ending a nasty streak of three straight declines.
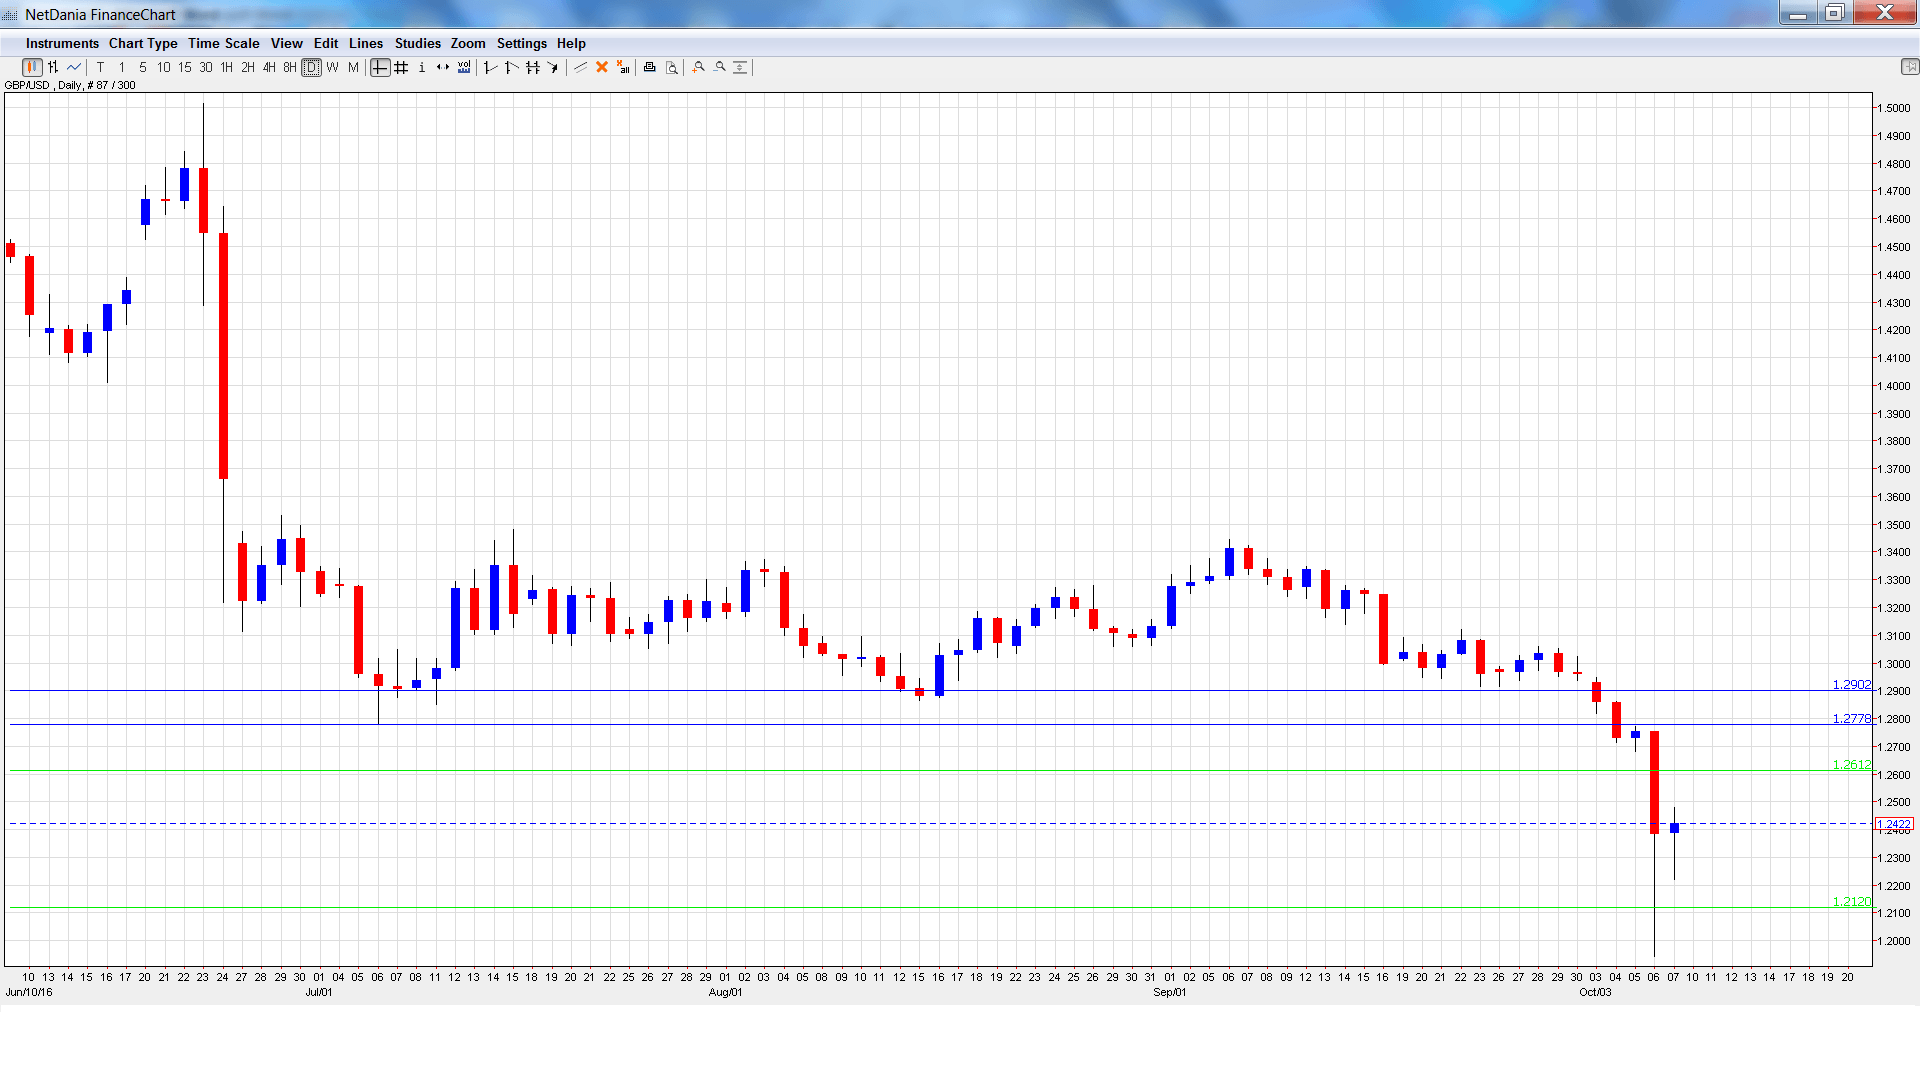
GBP/USD graph with support and resistance lines on it. Click to enlarge:
- BRC Retail Sales Monitor: Monday, 23:01. This indicator helps analysts predict the official retails sales report, which will be released later in the month. The index declined 0.9% in August, compared to a gain of 1.1% a month earlier.
- RICS House Price Balance: Wednesday, 23:01. The indicator provides a snapshot of the level of activity in the UK housing market. In August, the indicator climbed 12%, well above the forecast of 5%. The upswing is expected to continue in September, with an estimate of 14%.
- BoE Credit Conditions Survey: Friday, 8:30. This indicator is released each quarter. Stronger borrowing levels are linked to higher spending, so a positive report could push the pound higher.
* All times are GMT
GBP/USD Technical Analysis
GBP/USD opened the week at 1.2929 and quickly touched a high of 1.2946, as support held at 1.2902 (discussed last week). It was all downhill from there, as the pair briefly dropped to 1.1943 before rebounding. GBP/USD closed the week at 1.2422.
Live chart of GBP/USD:
Technical lines from top to bottom
With GBP/USD posting sharp losses last week, we begin at lower levels:
1.2902 has switched to a resistance role.
1.2778 was a cushion in mid-July.
1.2612 was a cushion back in 1985.
1.2400 is next.
1.2120 was the low point in September 1984.
1.1954 was a cap in May 1985. It is the final support line for now.
I remain bearish on GBP/USD.
The markets have been jittery about Brexit for months, despite decent UK numbers in the third quarter. With the pound suddenly sagging last week, weak market sentiment could send the currency to new 30-year lows.
Our latest podcast is titled Bold BOJ vs. Fearful Fed
Follow us on Sticher or iTunes
Further reading:
- For a broad view of all the week’s major events worldwide, read the USD outlook.
- For EUR/USD, check out the Euro to Dollar forecast.
- For the Japanese yen, read the USD/JPY forecast.
- For the kiwi, see the NZD/USD forecast.
- For the Australian dollar (Aussie), check out the AUD to USD forecast.
- For the Canadian dollar (loonie), check out the USD to CAD forecast.
