- The gold price reverses from a two-month high and snaps a four-day uptrend.
- A reflation fears spike precedes US CPI, worsening market sentiment.
- Concerns about stimulus in China contribute to the risk-off mood.
The gold price forecast is bullish for now. However, the yellow metal may find some corrective downside before continuing the uptrend.
-Are you looking for CFD brokers? Take a look at our detailed guideline to get started-
On Wednesday’s European session, gold (XAU/USD) posted its first daily loss in the week prior to its intraday lows at $1,825. Moreover, the yellow metal is retreating from a two-month high after failing to cross a resistance line many months ago, just before key US inflation data was released.
Inflation fears, concerns from China, and doubts about US stimulus measures are fueling the urge to protect against risk, which in turn supports the dollar and keeps gold prices high.
Despite the Fed Chairman’s failure to calm rate hikes backed by high inflationary expectations in the US, St. Louis Federal Reserve President James Bullard recently commented on recent concerns about the relationship. In an interview with CNBC at the start of the Asia meeting, Bullard predicted the US Federal Reserve will hike interest rates twice in 2022 after completing the rollback of its bond-buying program.
Beijing’s high inflation, on the other hand, contributes to swaying risk appetite with a 50% drop in the share price of Chinese company Fantasia Group after month-long trading free.
As a result, the S&P 500 futures are down 0.40 percent, and the 10-year US Treasury yield is down to a six-week low of 1.46%.
Near-term gold moves will be heavily influenced by US inflation data. The stock may move further south if price pressure continues to rise.
Gold price technical forecast: Off monthly highs
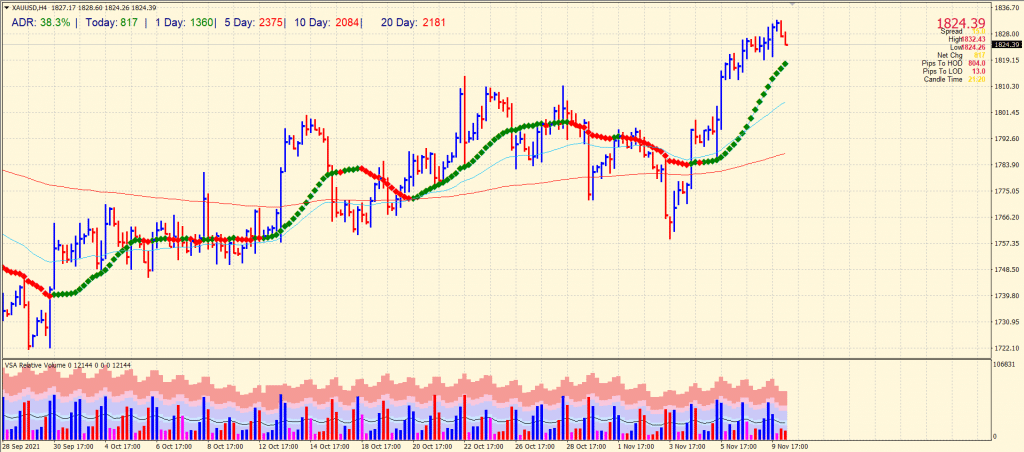
The gold prices remain off the monthly highs. However, the metal is now gaining a little traction. The price remains well above the key moving averages. Any downside correction will find strong support around 20-period SMA on the 4-hour chart at $1,819. The further downside may be seen until a horizontal level around $1,812 ahead of round number and 50-period SMA at $1,800.
-If you are interested in knowing about scalping forex brokers, then read our guidelines to get started-
On the upside, $1,832 remains a stiff resistance to break as it is the monthly high and a swing high where the price already found rejection twice in the previous months. Any breakout will trigger more buying towards $1,850.
Looking to trade forex now? Invest at eToro!
68% of retail investor accounts lose money when trading CFDs with this provider. You should consider whether you can afford to take the high risk of losing your money.
