- Gold remains bearish as the Fed’s aggressive rate hike plan weighs on it.
- Poor risk sentiment keeps the downside limited.
- Technically, the metal has broken monthly lows, looking at $1,874.
The gold price stays under pressure during the earlier part of the European session on Wednesday. The price has moved below the $1,900 mark and has posted the fresh monthly lows at $1,885.
–Are you interested in learning more about Canadian forex brokers? Check our detailed guide-
Fed’s 50-bps rate hike plan
Fed chair Powell reiterated the plan to raise the 50-bps interest rate in two meetings during his testimony at IMF. The US economic conditions indicate that the country has already passed the phase that required ultra-loos policy. Therefore, now is the time to start tightening. Hence, this proved as a major element in dragging the non-yielding metal lower.
The aggressive policy by Fed keeps the US dollar strongly bullish, which has weighed on the dollar-dominated gold. As a result, the US dollar index has propelled beyond the 102.00 level, eying a 5-year high around the 103.00 area as the fundamentals favor the greenback.
Risk sentiment
The ongoing Russia-Ukraine saga and the talks about banning Russian oil imports are keeping the risk sentiment deteriorating. But, on the other hand, the Covid restrictions imposed in China and the fear of global economic growth and inflation keep the investors risk-averse.
Hence, the investors seek refuge in gold as it’s a safe haven asset. So, the downside potential for gold remains limited.
What’s next to watch for gold price?
As the economic docket lacks any top-tier news, the market will be driven by broader risk sentiment. Meanwhile, Fed’s hawkish stance remains the key driver influencing gold prices.
Gold price technical analysis: Bears eying fresh lows
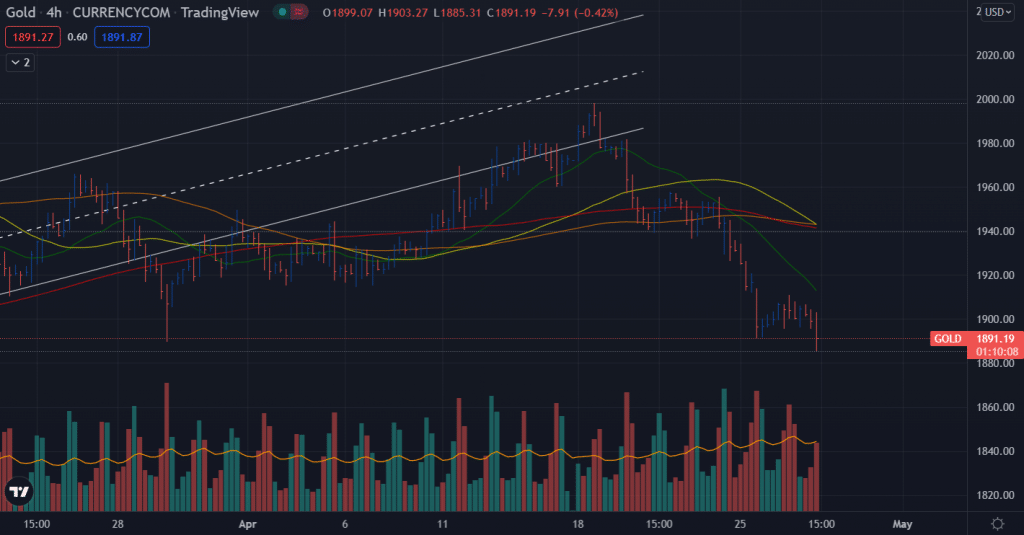
The gold price has broken the previous monthly lows of $1,889. However, it shows a potential to hit the next swing low area around $1,874. The 4-hour chart shows a strongly bearish scenario despite a minor gain from the daily lows. The key SMAs on the charts point south, while the 50, 100 and 200 SMAs converge at a spot, indicating further losses on the cards.
–Are you interested in learning more about high leveraged brokers? Check our detailed guide-
The volume bars for the last three price bars also indicate a bearish scenario. The volume is rising with the fall of prices. However, the volume is still below the average line. It means that the gold is waiting for a catalyst to act further.
Looking to trade forex now? Invest at eToro!
68% of retail investor accounts lose money when trading CFDs with this provider. You should consider whether you can afford to take the high risk of losing your money
