- The XAU/USD maintains a bearish bias as long as it stays under the downtrend line.
- The UK and Canadian inflation data could be decisive on Wednesday.
- A new lower low activates more declines.
The price of gold rebounded in the short term as the US dollar dropped a little. The yellow metal was trading at $1,657 at the time of writing. The metal is fighting hard to approach and highs.
-Are you looking for the best AI Trading Brokers? Check our detailed guide-
Fundamentally, the XAU/USD bounced back because the US retail sales came in mixed on Friday. The Retail Sales indicator rose by 0.0%, less than 0.2%, while Core Retail Sales surged by 0.1% versus a 0.1% drop. The US Prelim UoM Consumer Sentiment came in better than expected, but it has failed to boost the greenback.
Gold increased by 1.25% from Friday’s low of $1,640 to $1,660 today’s high. Today, the US is to release the Empire State Manufacturing Index, which is expected at -4.3 points below -1.5% in the previous reporting period.
The UK and Canadian inflation data could have a big impact on gold. The CPI and Core CPI represent high-impact events, so the volatility could be really high.
Dollar Index price technical analysis: Sideways movement
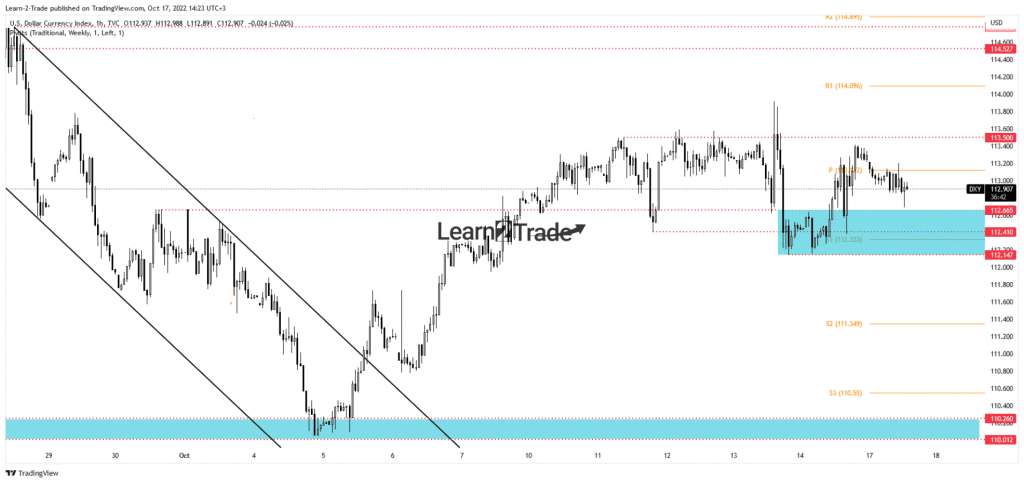
The Dollar Index moves sideways in the short term. That’s why XAU/USD could move in a range as well. The DXY maintains a bullish bias as long as it stays above the 112.41 – 112.14 zone. A new higher high activates further growth. DXY’s upside continuation could force the price of gold to approach and reach new lows. On the other hand, DXY’s drop below 112.14 may signal a new leg higher in gold.
Gold price technical analysis: Leg down
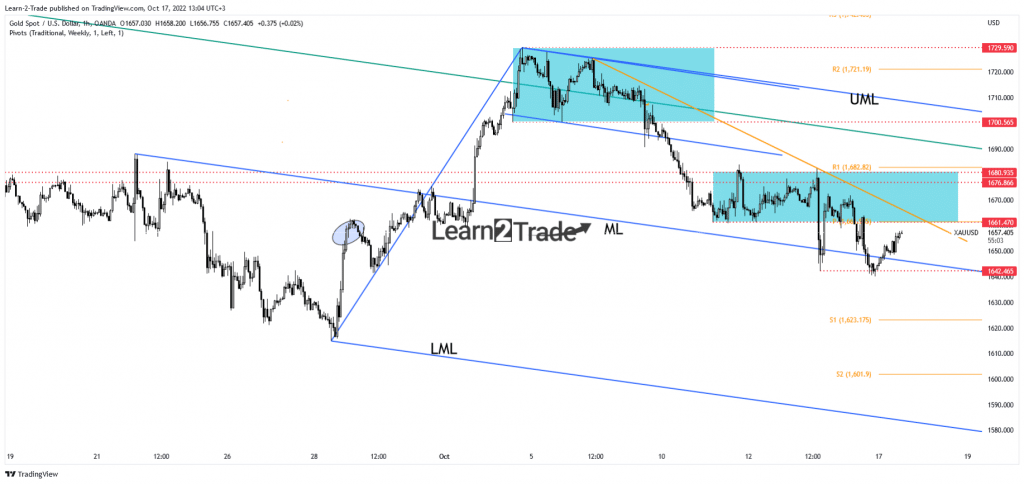
Technically, the bias remains bearish as long as it stays under the down trendline. The $1,642 stands as a downside obstacle. The price failed to take out this support and to stabilize below the median line (ML), signaling exhausted sellers. Testing the down trendline and the $1,661 key resistance, registering only false breakouts could result in a new sell-off. A larger downside movement could be activated by a valid breakdown below 1,642. A new lower low stabilizing below the median line (ML) announces a downside continuation.
-Are you looking for the best MT5 Brokers? Check our detailed guide-
The median line represents dynamic support. Staying above it may signal a new swing higher towards the upper median line (UML). Still, this scenario could take shape only if the price makes a valid breakout through the down trendline and after jumping and stabilizes above $1,680.
Looking to trade forex now? Invest at eToro!
67% of retail investor accounts lose money when trading CFDs with this provider. You should consider whether you can afford to take the high risk of losing your money.
