The New Zealand dollar corrected the big gains and closed lower after the disappointing CPI. Is it a change of course or a pause? The rate decision is the main event for this week. Here is an analysis of fundamentals and an updated technical analysis for NZD/USD.
The level of inflation in New Zealand did not rise as expected and this hurt the kiwi. The big question is: Will the RBNZ slow down the pace of rate hikes? We will get some answers this week.
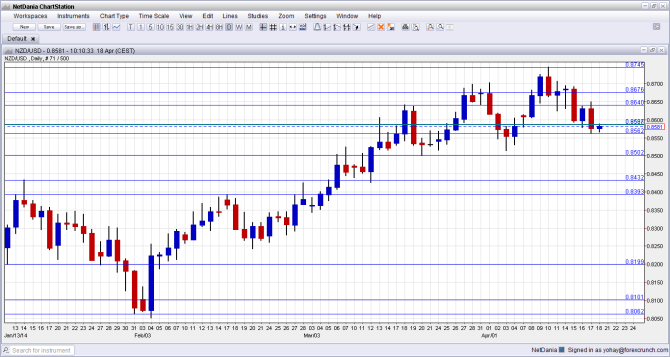
[do action=”autoupdate” tag=”NZDUSDUpdate”/]NZD/USD daily chart with support and resistance lines on it. Click to enlarge:
- Visitor Arrivals: Tuesday, 22:45. New Zealand enjoys a strong tourism sector, making visitor arrivals an important indicator for the whole economy. After a rise of 2.2% in February, a somewhat slower rise is likely for March.
- Credit Card Spending: Wednesday, 3:00. As retail sales numbers are published only once per quarter, this monthly indicator of consumption gives a good picture. Year over year spending grew 5.9% in February. A stronger growth rate is expected for March.
- Rate decision: Wednesday, 21:00. The Reserve Bank of New Zealand began the tightening cycle in March with a hike from 2.50% to 2.75%. It then made it clear that this is only the beginning and that rates would rise higher and faster. The RBNZ is expected to announce a second rate hike in this cycle, of 0.25% to 3% but could counter this with a softer statement, giving weight to the weaker inflation data. This could hint a pause in the next meeting and a more gradual rise all in all. Every word in the statement will be assessed to determine the next direction of NZD.
* All times are GMT.
NZD/USD Technical Analysis
Kiwi/dollar began the week above the 0.8640 line (mentioned last week) before falling and eventually losing support at 0.8586. An attempt to recapture the line did not succeed.
Technical lines, from top to bottom:
The multi year high of 0.8832 is not that far away. Below this level, we can mark the round number of 0.88 as minor resistance.
The new 2014 peak of 0.8745 joins the chart and will be watched on any upside move.
The 2013 peak of 0.8676 now switches to a pivotal line in the range. The previous 2014 peak of 0.8640 is close by and is still of significance.
It is followed by the stubborn May 2013 high of 0.8586 is another important line. The April 2014 swing low of 0.8560 is the next stepping stone on the way down.
0.85 is around number and could trigger comments by policymakers. A move above this line didn’t hold in early March 2014. 0.8435 was the peak in September and was retested in January. It is a strong double top.
0.8392 served as resistance was a recurring peak between November and February. 0.8335 capped a move higher in December and also had a role in the past. The pair fell short of this line in January 2014.
Below, 0.8280 supported the pair in February 2014 and also in the past. 0.82, worked as support several times: in September, October and also in December. It is somewhat weaker now.
I am bullish on NZD/USD
Despite the weaker than expected inflation numbers, the hawkish stance of the RBNZ remains firm. Wheeler and his colleagues are likely to stem doubts about their intentions to announce more rate hikes, even if they leave the warnings about the strength of the kiwi intact. In the US, positive data is not likely to hurt the kiwi.
More kiwi related: NZDUSD squeezed into resistance, looking for breakouts to the highside
Further reading:
- For a broad view of all the week’s major events worldwide, read the USD outlook.
- For EUR/USD, check out the Euro to Dollar forecast.
- For the Japanese yen, read the USD/JPY forecast.
- For GBP/USD (cable), look into the British Pound forecast.
- For the Australian dollar (Aussie), check out the AUD to USD forecast.
- For USD/CAD (loonie), check out the Canadian dollar forecast.
