The New Zealand dollar managed to maintain its range while some of its peers were retreating against the US dollar. The main event for the upcoming week is the monthly trade balance release . Here is an analysis of fundamentals and an updated technical analysis for NZD/USD.
The kiwi was pushed higher on a mix of 3 reasons, with the strong y/y GDP growth of 3.8% leading the way. A fourth rate hike in July is now on the cards. In the US, Yellen maintained the dovish tone and dismissed the uptick in inflation. Nevertheless, the kiwi lost some ground towards the end of the week. Is there a buy opportunity?
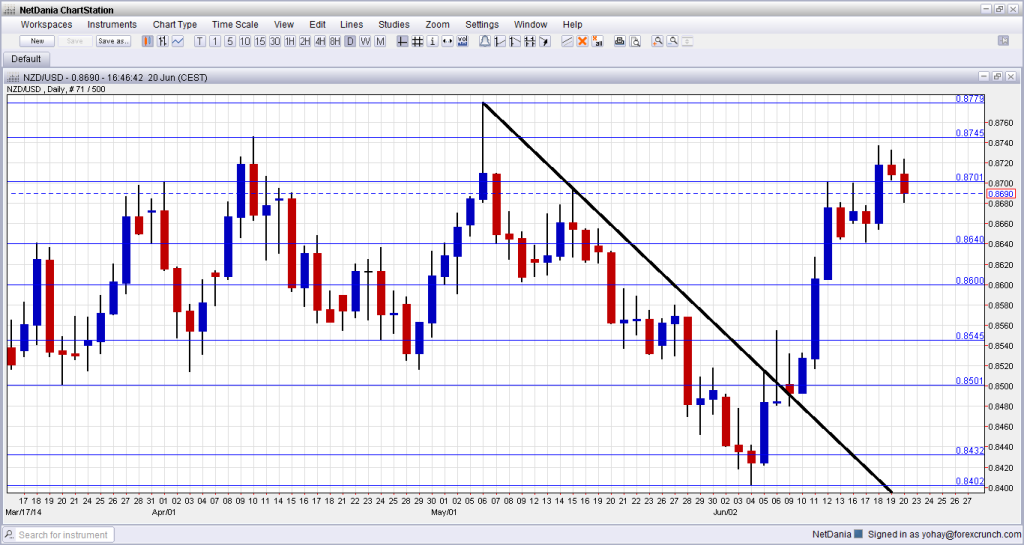
[do action=”autoupdate” tag=”NZDUSDUpdate”/]NZD/USD daily chart with support and resistance lines on it. Click to enlarge:
- Visitor Arrivals: Sunday, 22:45. Tourism has always been an important sector, especially after the Lord of the Rings movie series that was filmed there. After a rise of 1.7% in April, a small slide is likely in May.
- Credit Card Spending: Monday, 3:00. With official retail sales figures published only once per quarter, this measure of consumption has gained traction. After a gain of 3.2% in April, a similar advance is projected for May.
- Trade Balance: Thursday, 22:45. New Zealand enjoys a surplus in the balance of goods in the past 6 months. A 7th consecutive month is likely, but the plus side may be smaller than last month’s 534 million. Expectations stand at 250 million.
* All times are GMT.
NZD/USD Technical Analysis
Kiwi/dollar began the week with perfect range trading between the 0.8640 and the 0.87 levels mentioned last week. It then made a move higher, but eventually dropped back to the previous range.
Live chart of NZD/USD: [do action=”tradingviews” pair=”NZDUSD” interval=”60″/]
Technical lines, from top to bottom:
We start from the highest level in decades: 0.8840. This is the ultimate line of resistance. Above this point, only the round level of 0.90 awaits.
The previous 2014 peak of 0.8745 will be watched on any upside move. The round number of 0.87 proved its strength during May and joins the chart as key upside resistance.
The older swing high of 0.8640 worked as a pivotal line but eventually capped the pair. It is followed by the round number of 0.86, which worked as a cushion during May 2014.
The low of 0.8550 served as yet another pivotal line in the range. 0.85 is an important and very round number that looks like a clear separator of ranges.
0.8435 was the peak in September and was retested in January. It was a strong double top. 0.84, a round number, provided clear support in June.
0.8335 capped a move higher in December and also had a role in the past. The pair fell short of this line in January 2014.
Broken downtrend resistance
As the thick black line on the chart shows, downtrend resistance since reaching a peak in early May. The line was clearly broken now.
I remain bullish NZD/USD
The better than expected GDP and the lack of ability that the RBNZ has in reining the kiwi point to more upside gains after a week of consolidation.
More: EUR/NZD crashes to a one year low – euro carry trade already in play?
Further reading:
- For a broad view of all the week’s major events worldwide, read the USD outlook.
- For EUR/USD, check out the Euro to Dollar forecast.
- For the Japanese yen, read the USD/JPY forecast.
- For GBP/USD (cable), look into the British Pound forecast.
- For the Australian dollar (Aussie), check out the AUD to USD forecast.
- For USD/CAD (loonie), check out the Canadian dollar forecast.
