The New Zealand dollar remained in a steady range during the trading week, with the slight disappointments being unable to push the currency down. Inflation related numbers will be in the limelight this week. Here is an analysis of fundamentals and an updated technical analysis for NZD/USD.
New Zealand retail sales came out slightly below expectations, rising only 0.7% in Q1 2014. Also the Business NZ Manufacturing Index dropped from the highs to 55.2 points. Nevertheless, also the US dollar was unable to rally due to various reasons, and this kept the pair balance. Is this the calm before the storm?
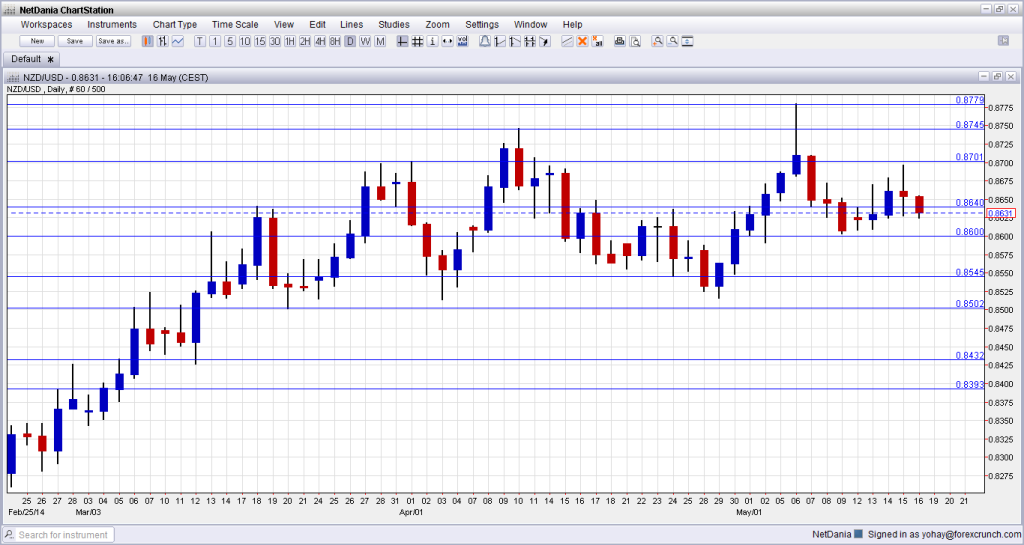
[do action=”autoupdate” tag=”NZDUSDUpdate”/]NZD/USD daily chart with support and resistance lines on it. Click to enlarge:
- PPI: Sunday, 22:45. Producer prices are published only once a quarter, making them especially important, even though consumer prices serve as the headlines. In Q4 2013, input PPI dropped by 0.7% and output prices by 0.4%. Both are expected to rise this time.
- Visitor Arrivals: Tuesday, 22:45. With a strong tourism sector, the number of arrivals makes a difference for the country and for the currency. After a drop of 3% in March, a significant rise is expected for April.
- Credit Card Spending: Wednesday, 3:00. With retail sales published only once per quarter, the use of credit cards fills the vacuum and provides a more up to data picture of spending. After a y/y leap of 8.1% in March, a small slide is likely for April.
- Inflation Expectations: Thursday, 3:00. This official publication from the RBNZ is telling about future rate hike plans. Expectations reached 2.3% in Q4 2013, closer to the high end of the range seen in recent years. A small uptick is expected for Q1 2014.
* All times are GMT.
NZD/USD Technical Analysis
Kiwi/dollar kicked off the week capped by the 0.8640 line mentioned last week. It then managed to break this line but after failing to break the round number of 0.87, the pair retreated.
Technical lines, from top to bottom:
The multi year high of 0.8842 is not that far away. Below this level, the recent 2014 high of 0.8780 serves as minor resistance at the moment.
The previous 2014 peak of 0.8745 joins the chart and will be watched on any upside move. The round number of 0.87 proved its strength during May and joins the chart as key upside resistance.
The older swing high of 0.8640 is close by and is still of significance as a pivotal line. It is followed by the round number of 0.86, which worked as a cushion during May 2014.
The low of 0.8550 is the next stepping stone on the way down and now serves as important support. 0.85 is around number and could trigger comments by policymakers. A move above this line didn’t hold in early March 2014.
0.8435 was the peak in September and was retested in January. It was a strong double top. 0.8392 served as resistance was a recurring peak between November and February.
0.8335 capped a move higher in December and also had a role in the past. The pair fell short of this line in January 2014. Below, 0.8280 supported the pair in February 2014 and also in the past. 0.82, worked as support several times: in September, October and also in December. It is somewhat weaker now.
I turn bearish on NZD/USD
The kiwi managed to hold its ground while other currencies experienced volatility. However, with the lack of any positive and exciting data from New Zealand, the improvements we are seeing in the US might kick in, and together with the desire of the RBNZ to weaken the currency, we could begin seeing a decline.
More kiwi: AUDNZD Dips Remain Attractive To Buyers
Further reading:
- For a broad view of all the week’s major events worldwide, read the USD outlook.
- For EUR/USD, check out the Euro to Dollar forecast.
- For the Japanese yen, read the USD/JPY forecast.
- For GBP/USD (cable), look into the British Pound forecast.
- For the Australian dollar (Aussie), check out the AUD to USD forecast.
- For USD/CAD (loonie), check out the Canadian dollar forecast.
