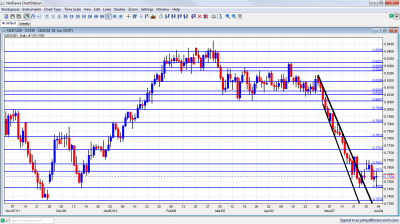
NZD/USD tried to stage a recovery early in the week, but eventually remained in low ground, still clinging to support. Is a recovery coming, or are new falls around the corner? No events are planned this week in New Zealand, so the outlook is mostly a technical analysis for NZD/USD.
Apart from the storm in Europe, indicators in New Zealand didn’t really help the kiwi. Building consents dropped by 7.2% and the highly regarded NBNZ Business Confidence fell to lower ground. US Non-Farm Payrolls, which were horrible, eventually helped the kiwi stabilize.
Updates: There are no scheduled releases this week. The kiwi is off to a good start this week, as NZD/USD has moved up, and was trading at 0.7572. The New Zealand dollar climbed about the 0.76 in the Asian session, but retraced. The pair was trading at 0.7536. The kiwi continues to push higher, helped by the stellar release of the Australian GDP. NZD/USD was trading at 0.7634. Strong employment data in Australia helped the New Zealand dollar keep its recent momentum. NZD/USD was trading at 77.28, its highest level since mid – May.
NZD/USD daily chart with support and resistance lines on it. Click to enlarge:
NZD/USD Technical Analysis
Kiwi/dollar began the week on higher ground, but this changed later on. It eventually found support at 0.7460 (mentioned last week), before closing at 0.7531.
Technical lines, from top to bottom:
0.8060 was resistance in October and support beforehand.. It was also tested in January and in March, is much weaker now after only temporarily stopping the fall. The round number of 0.80 managed to cap the pair in November and remains of high importance, especially due to its psychological importance.
Another round number, 0.79, is key resistance, after being a very distinct line separating ranges. 0.7810 was a double bottom in May 2012 and also served as resistance at the end of 2011, and now returns to this role after the crash.
0.7773 was the bottom border of a range at the beginning of 2012, and also in December. 0.77 provided support in December and serves as resistance..
0.7620 provided support in May 2012 and is resistance once again, although weaker than in previous weeks. 0.7550 is resistance once again, even after the breakdown. It was a very distinct line separating ranges and had a similar role back in January.
Below, 0.7460 is significant support after working as support at the end of 2011 and also in May and June 2012. This is key support. 0.7370, which was the trough in December is low support. This is a significant line if 0.7460 breaks.
0.7308 is minor support after working as such at the beginning of 2011. 0.72 worked in both directions during the past few years.
0.71 is the last line, after being a distinct trough in March 2011.
Steep Channel Broken
As the graph shows, the breakout of the channel was indeed significant for stopping the downfall.
I remain bearish on NZD/USD
With events in Europe happening so quickly, the kiwi will likely suffer. 0.7460 is key support.
Further reading:
- For a broad view of all the week’s major events worldwide, read the USD outlook.
- For EUR/USD, check out the Euro to Dollar forecast.
- For the Japanese yen, read the USD/JPY forecast.
- For GBP/USD (cable), look into the British Pound forecast.
- For the Australian dollar (Aussie), check out the AUD to USD forecast.
- For USD/CAD (loonie), check out the Canadian dollar forecast
- For the Swiss Franc, see the USD/CHF forecast.

