- TRON’s coin retreated from the recent recovery high.
- TRX/USD is confined to a long-term downside trend.
At the time of writing, TRX/USD is changing hands at $0.0160. The coin has gained over 15% in seven 24 days, however, the upside momentum started fading away after the price had hit $0.0175 high. Currently, TRON takes 11th place in the global cryptocurrency market rating with the market value of $1.1 billion and an average daily trading value of $638 million.
TRX/USD, the technical picture
Looking technically, TRX/USD has created a lower high at $0.0175 moving within the long-term bearish trend from June, 2019 high at $0.0400. The coin has lost about 60% from the peak and hit the bottom at $0.0117. Despite the recovery, the price failed to reach the previous recovery high at $0.0186 (September 21), which may be interpreted as a bearish signal.
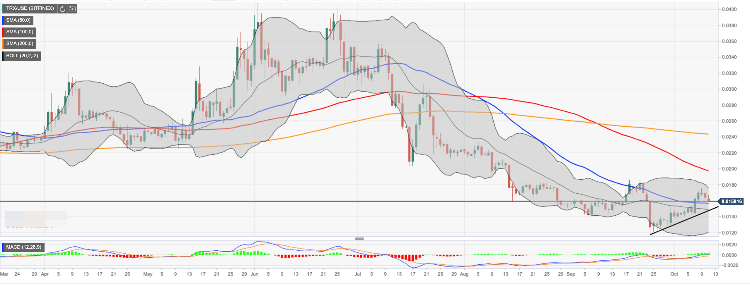
The initial support is created by SMA50 (Simple Moving Average) on a daily chart at $0.0156. A sustainable move below this handle will allow for an extended correction towards the short-term upside trendline coupled with the lower line of one-day Bollinger Band at $0.0147. Once it is out of the way, the sell-off is likely to gain traction with the next focus on $0.0140.
On the upside, We will need to see a sustainable move $0.0175 to negate an immediate bearish forecast and create a precondition for further recovery.
TRX/USD, daily chart