- DXY is under bearish pressure trading at one-week lows.
- A break below 98.63 key support could lead to further losses.
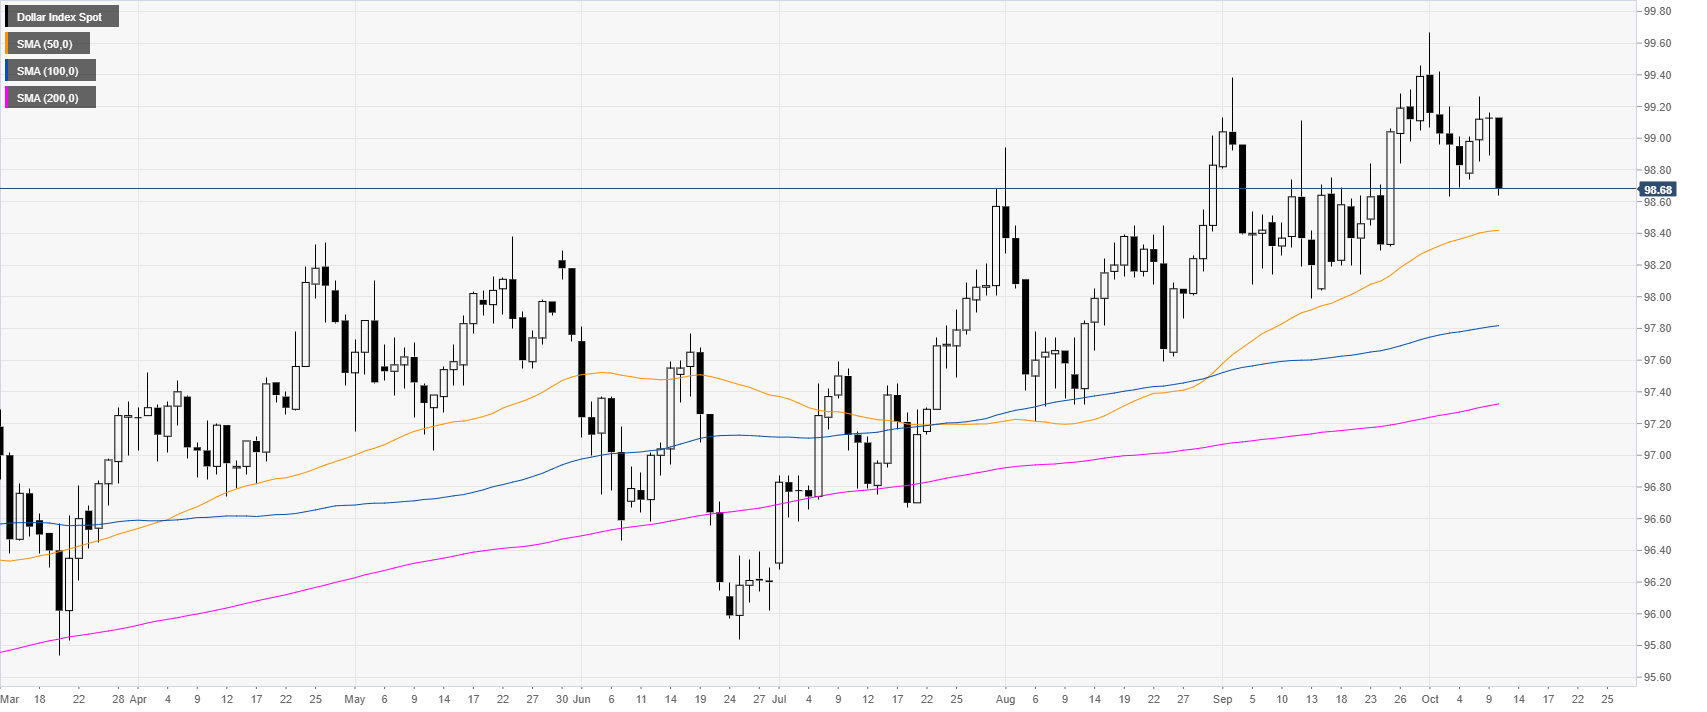
DXY daily chart
The US Dollar Index (DXY) is in a bull trend above the main daily simple moving averages (DSMAs). Earlier in the New York session, the US Core Consumer Price Index (CPI) matched analysts’ expectations at 2.4% YoY.
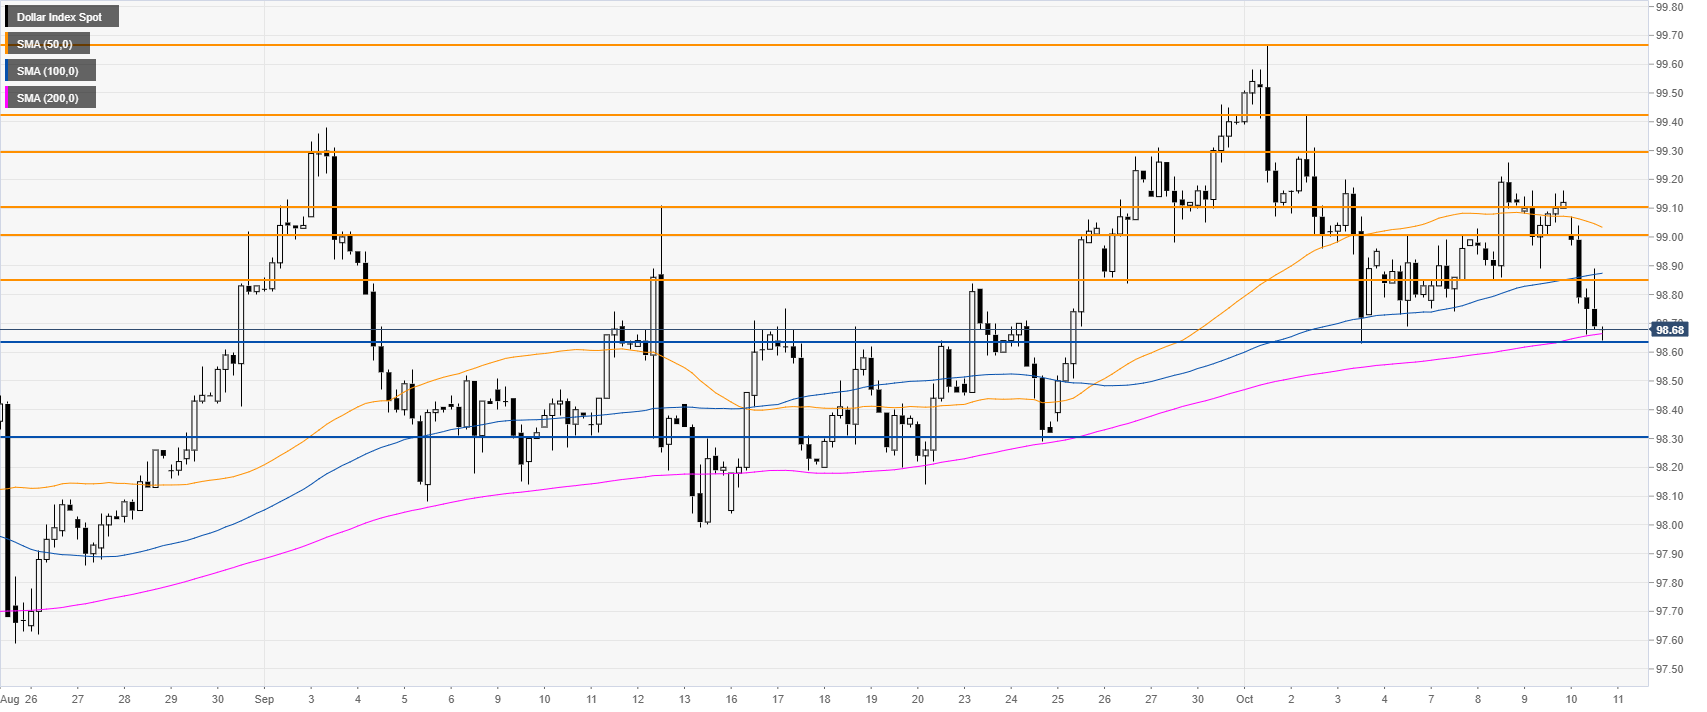
DXY four-hour chart
DXY is trading at one-week lows, challenging the 96.64 support and the 200 SMA on the four-hour chart. If the market hold above this level DXY is set to remain with the current October range.
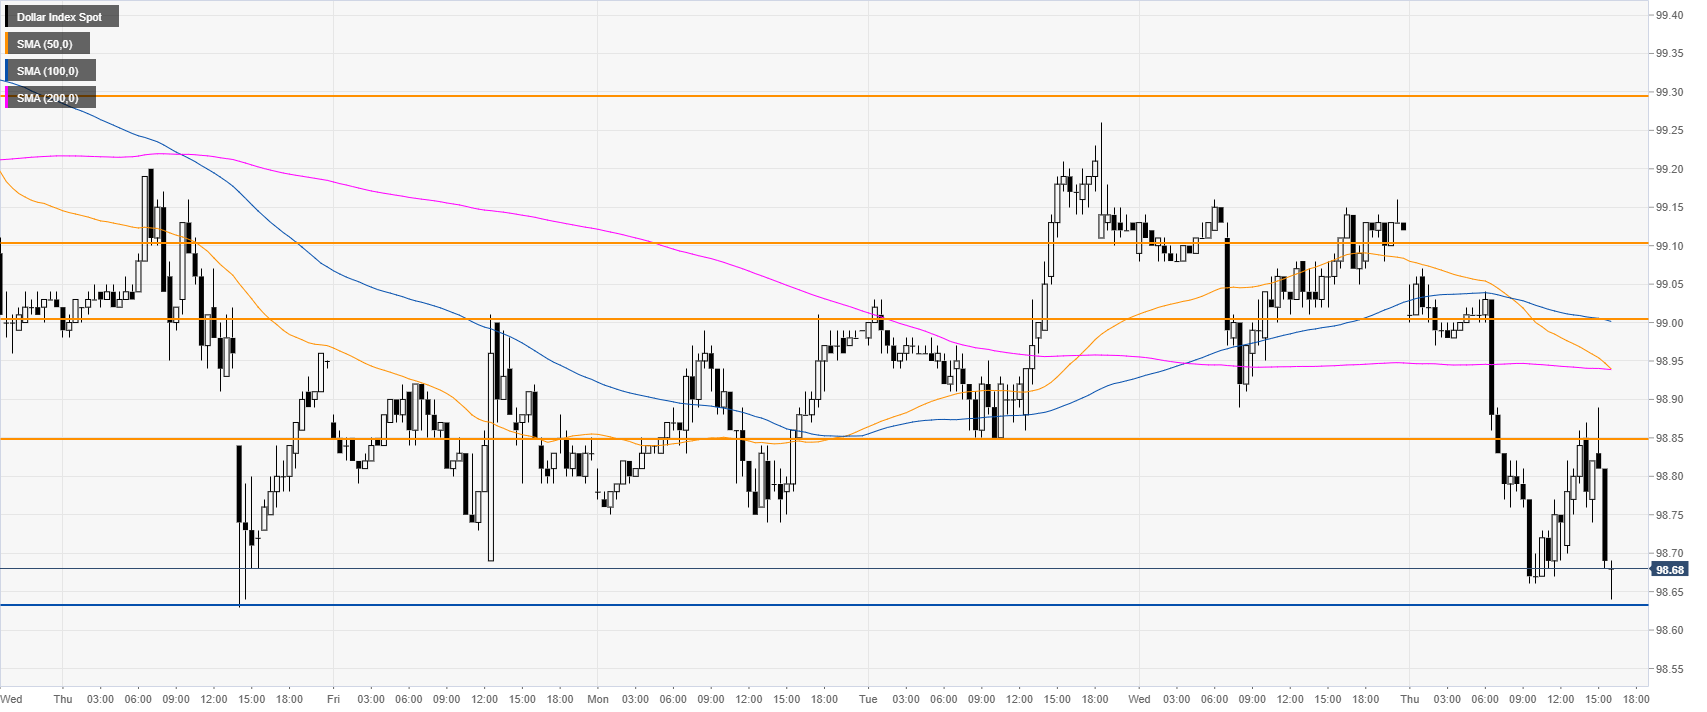
DXY 30-minute chart
DXY is trading below the main SMAs, suggesting bearish momentum in the near term. Resistances are seen at the 98.85 and 99.00 price levels.
Additional key levels
