- Opposite results in labor indexes in both countries cause an upward trend in the USD/CAD.
- More jobs were created than expected in the United States and fewer in Canada.
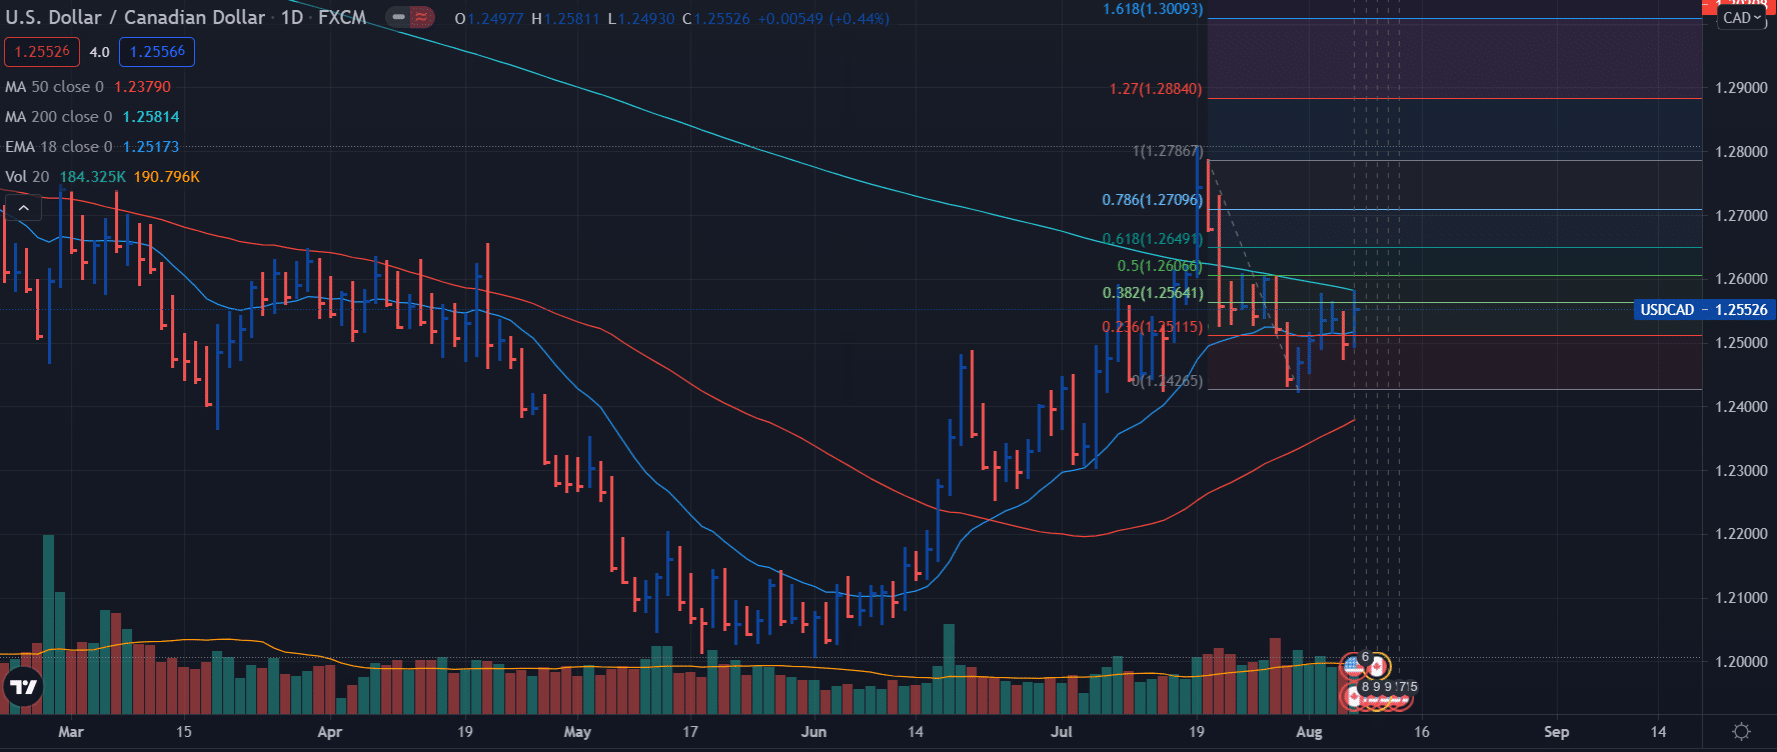
- Next week’s trend is forecasted to be bullish if the 1.258o is broken.
The weekly forecast for the USD/CAD pair is bullish. The contrast in the labor results of Canada and the United States drove the rise of the USD/CAD pair, achieving a weekly close above the 1.2550.
–Are you interested to learn more about automated forex trading? Check our detailed guide-
On the US side, the labor statistics office revealed on Wednesday that non-farm payrolls increased in July by 943,000, surpassing the 870,000 expected for the month. Additionally, in the review of the data for June and May, authorities found that 119,000 more jobs were generated during those months than previously calculated.
The unemployment rate in the country stood at 5.4% after a rate of 5.9% in June. After publishing these reports, the US dollar index rose 0.4%.
On the part of the Fed, signs of a possible reduction of asset purchase program are beginning to be seen after some important figures made statements related to this. Like the case of Fed Vice Chairman Richard Clarida, who commented that there could certainly be announcements at the end of the year about a gradual reduction.
On the Canadian side, unemployment statistics improved but at a slower than the estimated rate. The unemployment rate decreased 0.3% to 7.5% compared to 7.8% in June. However, the number of jobs created during the last month was 94,000, far from the estimate of analysts who predicted 177,500 new jobs for July.
Upcoming events
The most relevant USD/CAD pair events will appear in the United States and are inflation-related. Inflation is a topic that all economic actors are watching out for right now. For next week the consumer price and product price indices will be published. The US CPI is expected to decline to 0.5% against June’s 0.9% figure. The Fed policy directly depends on it. The good results of these indexes will further strengthen the US dollar. It is important to remember that the CPI is one of the aspects that the Fed authorities are monitoring to decide on a future change in their monetary policy.


USD/CAD weekly technical forecast: 200-day SMA to resist
During the week, the price was moving around the 23.6% Fibonacci level. From this point, the 200-day SMA level will represent an important resistance level. Currently, that level represents the 1.2580 to 1.2585 zone. Breaking through that barrier, bullish traders will see this as a trigger, and the next resistance level will be 1.2700.
–Are you interested to learn more about forex signals? Check our detailed guide-
USD/CAD next week forecast
Traders expect a rebound if the price fails to break the resistances. However, more odds o abullish break exist for now. Next week, the resistance level is around 1.2580, and the support level is at 1.2422, which is the low of July 30.
Looking to trade forex now? Invest at eToro!
67% of retail investor accounts lose money when trading CFDs with this provider. You should consider whether you can afford to take the high risk of losing your money.
