- The US central bank boosted its benchmark overnight rate by 25 basis points.
- The Fed hinted at possibly ending the fastest policy tightening since the 1980s.
- April saw a strong increase in wage and employment growth in the US.
The USD/JPY weekly forecast is slightly bullish as the US jobs report indicates a still-tight US labor market. This report might force the Fed to keep rates higher for longer.
–Are you interested in learning more about forex bonuses? Check our detailed guide-
Ups and downs of USD/JPY
USD/JPY had a mostly bearish week, with the dollar weakening after the Fed hinted at a pause. At the same time, the yen gained as a haven amid banking worries in the US. On Friday, the pair reversed some losses when the dollar gained on a positive jobs report.
On Wednesday, the US central bank boosted its benchmark overnight rate by 25bps. The bank also hinted at possibly ending the fastest policy tightening since the 1980s.
April saw a strong increase in wage and employment growth in the US, signs of a robust labor market. This resilience might push the Federal Reserve to keep interest rates higher longer.
Next week’s key events for USD/JPY
Consumer pricing data for April, due on May 10th, could provide more information about whether the Fed’s interest rate rises are reducing inflation.
Fears of stagflation are growing as markets await the inflation data. Stagflation is the result of both slow growth and ongoing inflation.
Some fear the recent turmoil in the banking industry may hurt lending and further restrain GDP. This would compel the Fed to drop rates before inflation is under control.
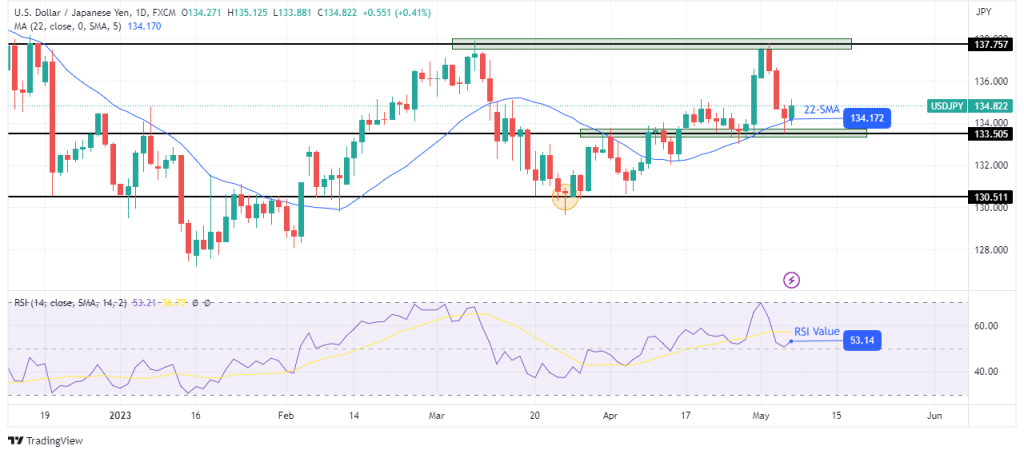
USD/JPY weekly technical forecast: Buyers are poised to retest the 137.75 resistance

The daily chart’s bias for USD/JPY is bullish because the price is trading above the 30-SMA. It also makes higher highs and lows, consistent with a bullish trend. At the same time, the RSI trades above 50, supporting bullish momentum.
The uptrend paused at the 137.75 resistance level, where bears came in to retrace the recent move. The pullback went down to retest the 133.50 support level and the 30-SMA. The price is currently at a strong support zone and might bounce higher.
There is a high probability that bulls will come back next week and retest the 137.75 resistance. However, if bears break below the SMA, we might get a shift in sentiment with the next target at 130.51.

