The Canadian dollar reversed directions last week, dropping close to 100 points. USD/CAD closed the week at 1.2977. This week’s highlight is GDP. Here is an outlook on the major market-movers and an updated technical analysis for USD/CAD.
In the US, new home sales beat expectations and durable goods reports also beat their estimates. At the same time, GDP matched the forecast and Janet Yellen remained cautious in Jackson Hole. Anticipation is high ahead of a busy September that features both the Fed and the BoC making critical rate decisions.
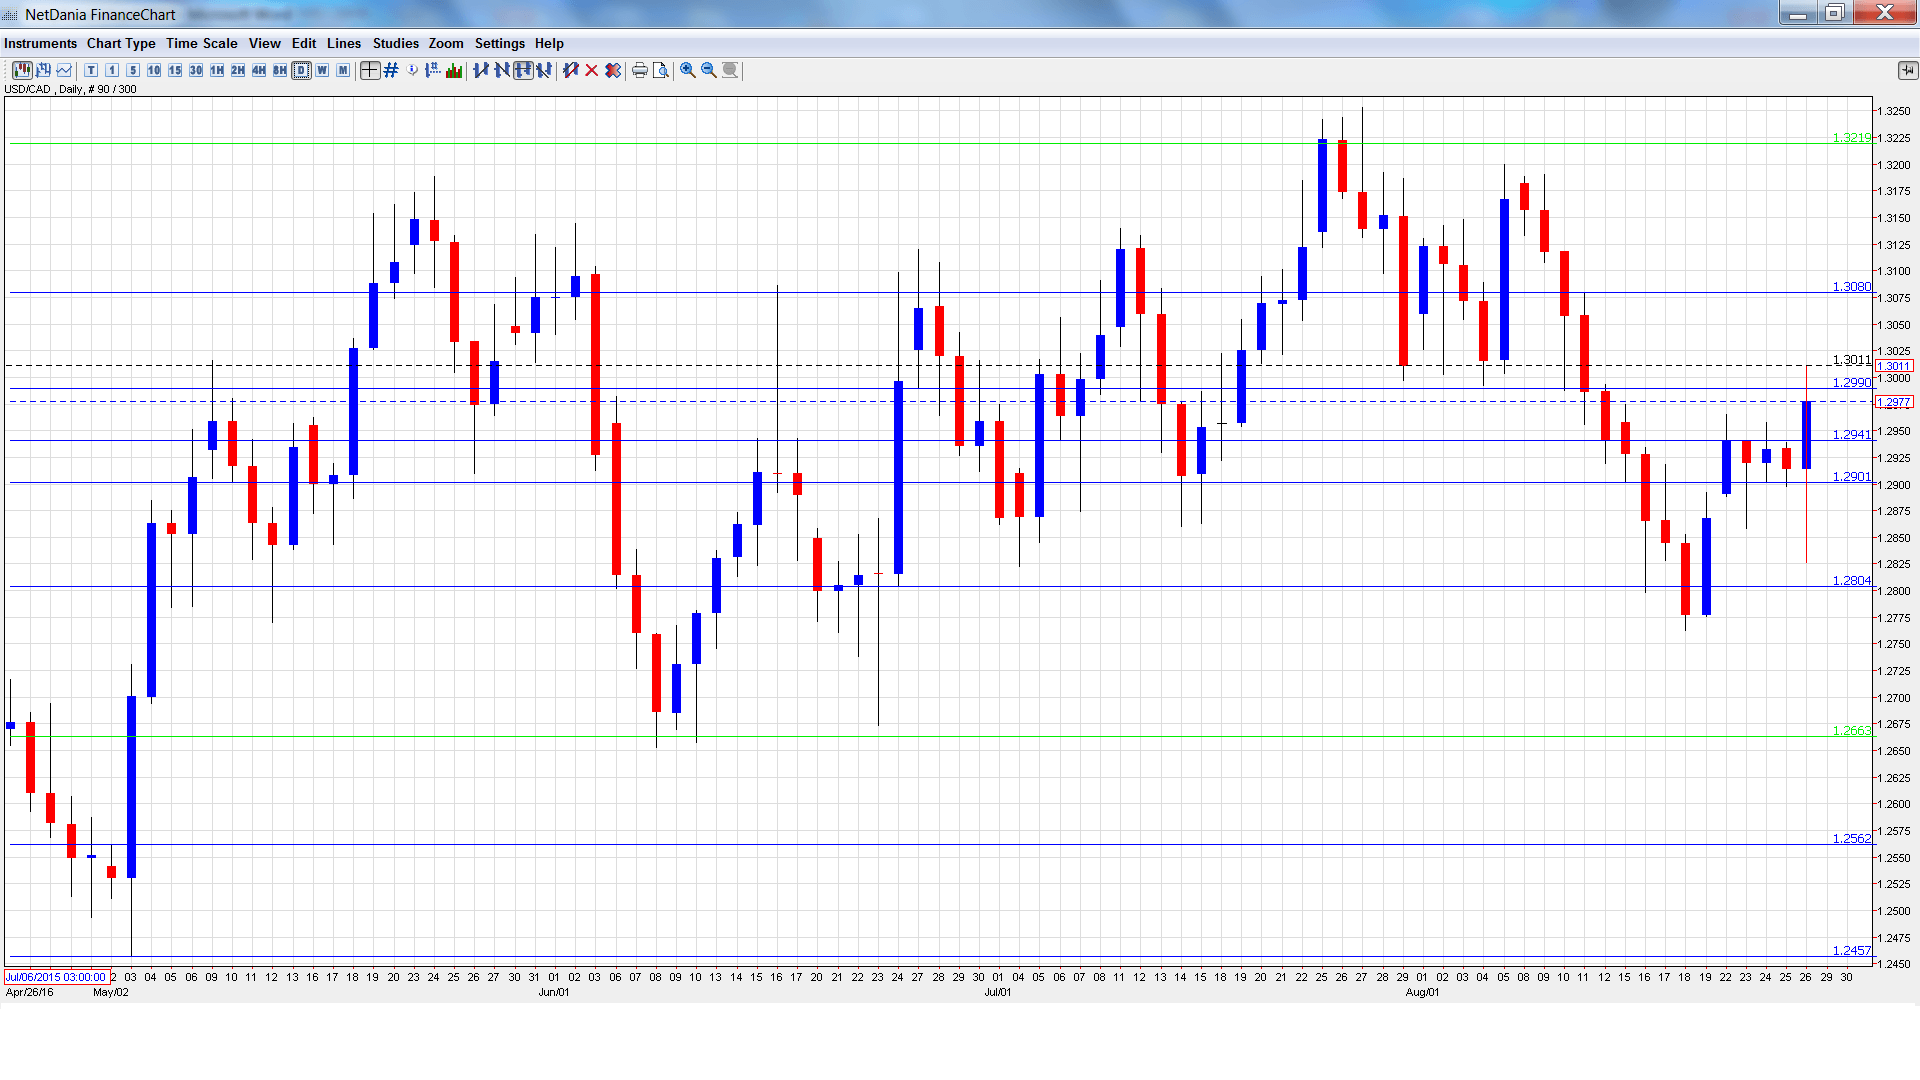
USD/CAD daily graph with support and resistance lines on it. Click to enlarge:
- Current Account: Tuesday, 12:30. Canada’s current account deficit widened to C$16.8 billion in Q1, but this was better than the forecast of a C$17.4 billion deficit. Will the deficit narrow in the second quarter report?
- RMPI: Tuesday, 12:30. This indicator helps measure inflation in the manufacturing sector. In June, the indicator gained 1.8%, well below the forecast of 3.2%. The markets will be hoping for a stronger gain in July.
- GDP: Wednesday, 12:30. Canada publishes GDP on a monthly basis. In May, the economy contracted by 0.6%, within expectations. GDP is expected to rebound in the June report, with an estimate of +0.5%.
- RBC Manufacturing PMI: Thursday, 13:30. The PMI continues to show slight expansion in the manufacturing sector. The index was almost unchanged in June, with reading of 51.9 points.
- Trade Balance: Friday, 12:30. This indicator is closely watched, as it is linked to currency demand. Canada’s trade deficit has widened for two straight months, reaching C$3.6 billion in June. This was considerably higher than the forecast of C$2.6 billion. The estimate for the July report stands at C$3.2 billion.
- Labor Productivity: Friday, 12:30. The indicator rose 1.4% in the first quarter, matching the forecast. The estimate for Q2 is 0.2%.
USD/CAD opened the week at 1.2890. After a quiet week, the pair showed strong volatility on Friday. USD/CAD dropped to a low of 1.2826 and then reversed directions and climbed to a high of 1.3011, testing resistance at 1.2990 (discussed last week). The pair closed the week at 1.2977.
Live chart of USD/CAD:
Technical lines, from top to bottom
We begin with resistance at 1.3353.
1.3219 was a cap in April.
1.3081 is next.
1.2990 was tested in resistance late in the week.
1.2900 remains busy and has switched to a support role.
1.2804 was an important cushion after the Brexit vote in late June.
1.2663 is next.
1.2562 was a cap in July 2015.
1.2459 is the final support line for now.
I am neutral on USD/CAD
The Fed is slightly less dovish than usual and a December hike is certainly on the table. However, rising oil prices could boost the Canadian dollar.
Our latest podcast is titled Time to inflate inflation targeting and the suspicious oil rally
Follow us on Sticher or on iTunes
Further reading:
- For a broad view of all the week’s major events worldwide, read the USD outlook.
- For EUR/USD, check out the Euro to Dollar forecast.
- For the Japanese yen, read the USD/JPY forecast.
- For GBP/USD (cable), look into the British Pound forecast.
- For the Australian dollar (Aussie), check out the AUD to USD forecast.
- For the kiwi, see the NZDUSD forecast.
