The Canadian dollar posted small gains last week, closing at 1.3090. This week’s key events are Core Retail Sales and CPI. Here is an outlook on the major market- movers and an updated technical analysis for USD/CAD.
In the US, retail sales and CPI were better than expected and also Yellen sounded upbeat about the US economy. Canadian Manufacturing Sales jumped 2.3%, well above the forecast of 1.4%. This marked the indicator’s strongest reading in 11 months.
Updates:
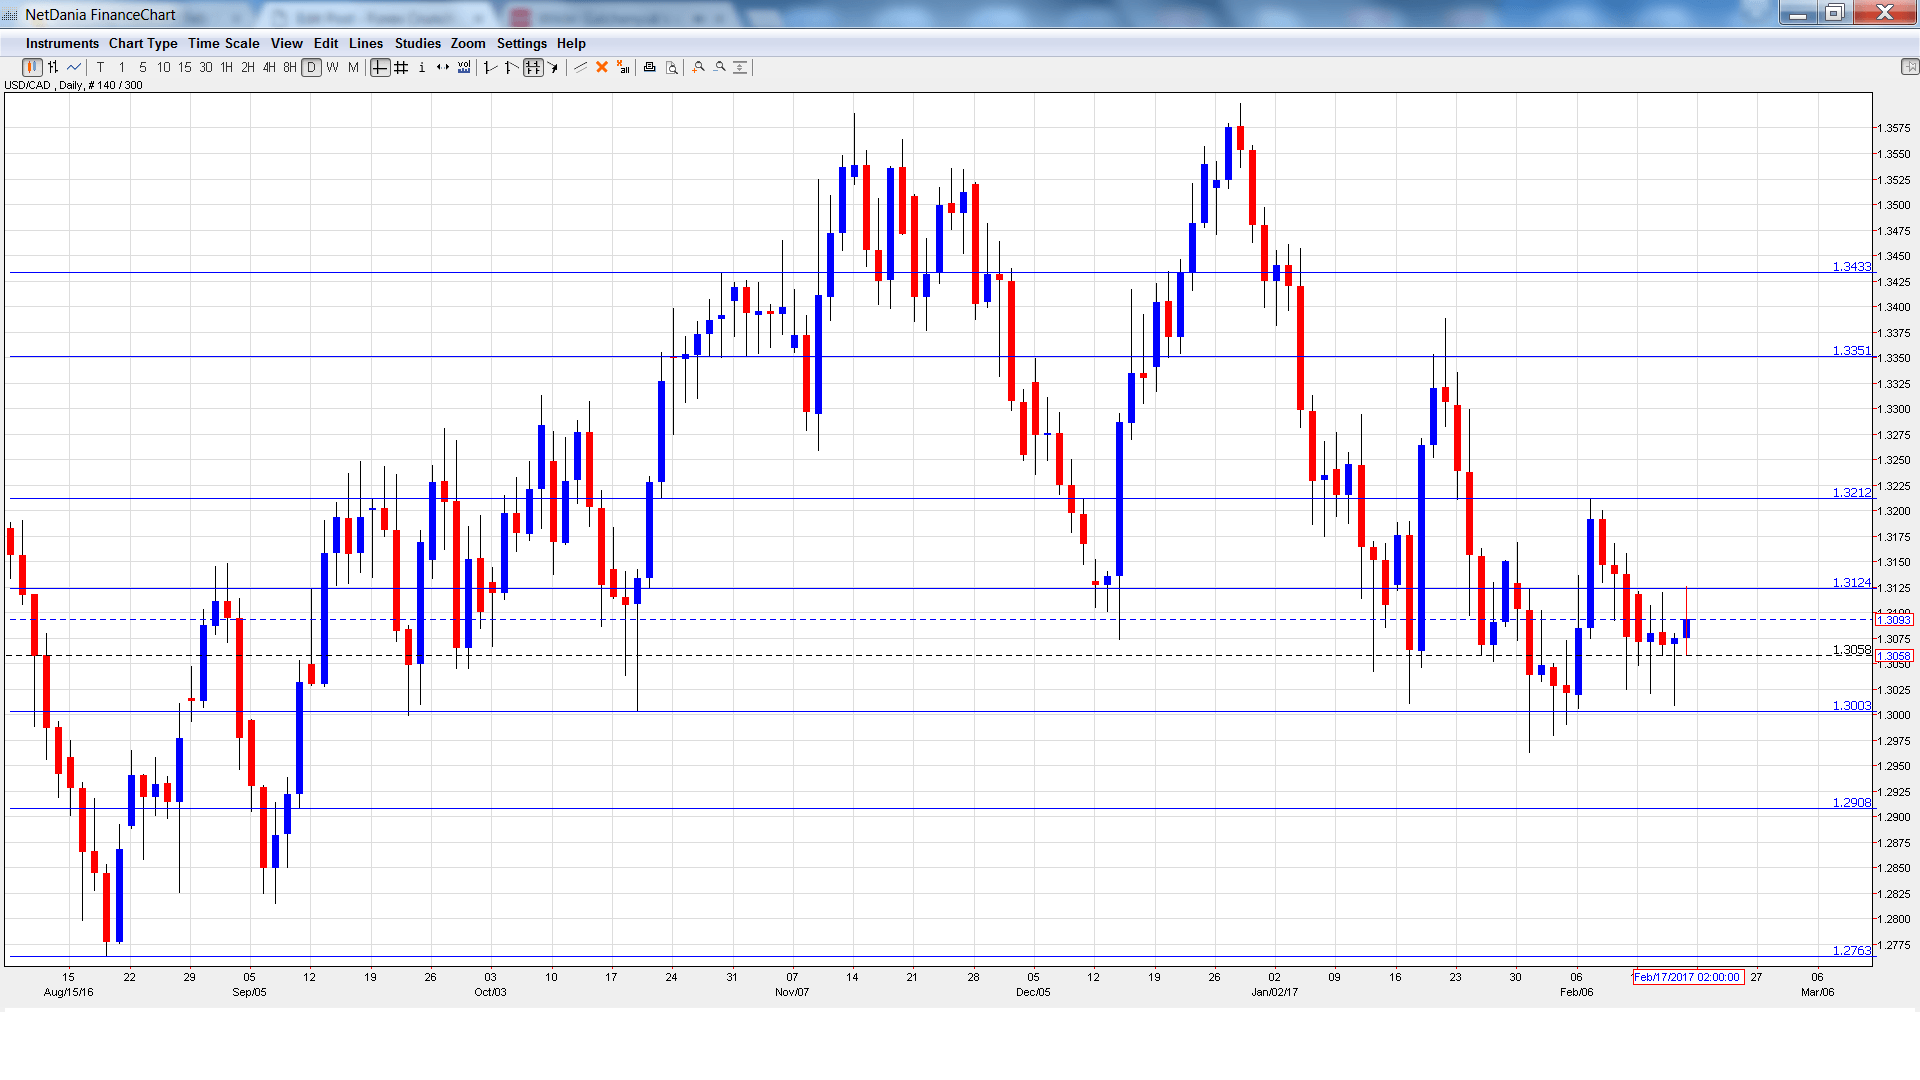
USD/CAD daily graph with support and resistance lines on it. Click to enlarge:
- Wholesale Sales: Monday, 13:30. This indicator slipped to 0.2% in November, shy of the forecast of 0.3%. The estimate for the December report is 0.4%.
- Core Retail Sales Sales: Wednesday, 13:30. This event should be treated as a market-mover, as an unexpected reading could have a strong impact on the direction of USD/CAD. In November, the estimate slipped to 0.1%, matching the forecast. The markets are expecting a strong improvement in December, with an estimate of 0.8%.
- Retail Sales: Wednesday, 13:30. Retail Sales is the primary gauge of consumer spending. The indicator dropped to 0.2% in November, short of the estimate of 0.5%. The downward trend is expected to continue in December, with a forecast of 0.1%.
- Corporate Profits: Thursday, 13:30. Corporate Profits jumped 14% in Q3, after posting declines over four straight quarters. Will we see another strong reading in Q4?
- CPI: Friday, 13:30. Canadian inflation levels remain at low levels, with CPI posting two straight declines. In December, the index declined 0.2%, below the estimate of 0.0%. The forecast for January stands at 0.3%.
- Trimmed Core CPI: Friday, 13:30. Trimmed Core CPI was introduced in December 2016. It excludes the most volatile items that make up CPI. The index has posted two straight readings of 1.6%.
* All times are GMT
USD/CAD Technical Analysis
USD/CAD opened the week at 1.3118 and touched a low of 1.3009, as support held at 1.3003 (discussed last week). Late in the week, the pair climbed to a high of 1.3126. The pair closed the week at 1.3090.
Live chart of USD/CAD:
Technical lines, from top to bottom
We begin with resistance at 1.3433. This line was the high point in October.
1.3351 is next.
1.3212 has been a cap in February.
1.3124 has switched to resistance. It is a weak line.
1.3003 is providing support. This line is protecting the symbolic 1.30 level.
1.2908 has held in support since September 2016.
1.2763 is next.
1.2653 has provided support since June 2016.
1.2562 is the final support line for now.
I am neutral on USD/CAD
Trump continues to make protectionist statements, but has said that he merely wants to “tweak” trade relations with Canada. The Canadian dollar is also affected by oil prices, which haven’t shown much movement lately and could break out in either direction.
Our latest podcast is titled Oil upside and euro underperformance
Follow us on Sticher or iTunes
Safe trading!
Further reading:
- For EUR/USD, check out the Euro to Dollar forecast.
- For the Japanese yen, read the USD/JPY forecast.
- For GBP/USD (cable), look into the British Pound forecast.
- For the Australian dollar (Aussie), check out the AUD to USD forecast.
- For the kiwi, see the NZDUSD forecast.
