The Canadian dollar posted gains for a second straight week, gaining 110 points. USD/CAD closed the week at 1.3021, and broke below the 1.30 level for the first time since mid-September. This week’s key event is Employment Change. Here is an outlook on the major market- movers and an updated technical analysis for USD/CAD.
In the US, controversial moves by Donald Trump, such as the spat with Mexico and a travel ban on Moslem refugees has hurt the greenback. US job numbers were mixed, as Nonfarm Payrolls was better than expected but wage growth was weaker than expected. In Canada, GDP expanded 0.4%, edging above the forecast of 0.3%. This positive reading boosted the Canadian dollar.
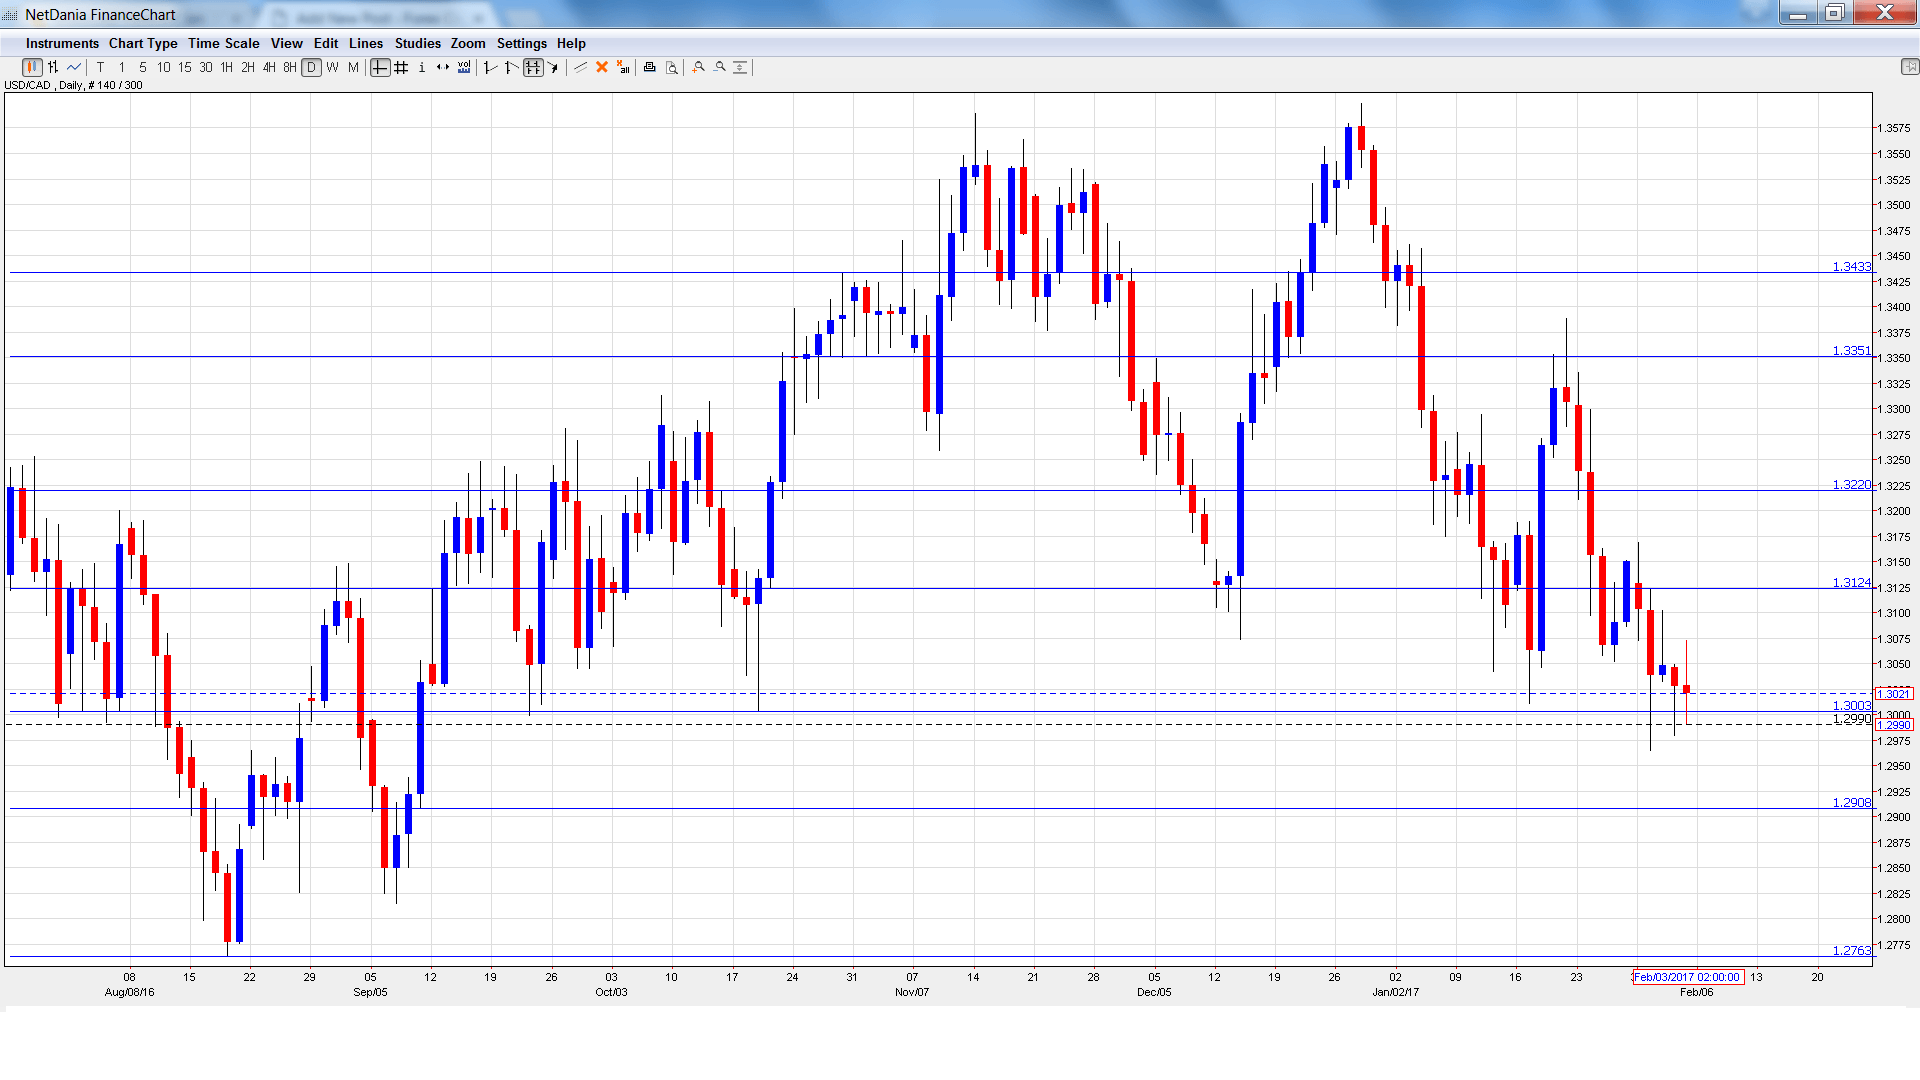
[do action=”autoupdate” tag=”USDCADUpdate”/]USD/CAD daily graph with support and resistance lines on it. Click to enlarge:
- Trade Balance: Tuesday, 13:30. Canada unexpectedly posted a trade surplus of C$0.5 billion in November, compared to the forecast of a deficit of C$-1.6 billion. The surplus is expected to increase to C$1.2 billion in December.
- Ivey PMI: Tuesday, 15:00. The PMI improved to 60.8 in December, easily beating the forecast of 56.0. Another strong reading is expected in January, with an estimate of 58.3.
- Housing Starts: Wednesday, 13:15. This indicator provides a snapshot of the strength of the housing market. In December, the indicator jumped to 207 thousand, easily beating the forecast of 187 thousand. Another reading above the 200K level is expected in January, with an estimate of 202 thousand.
- NHPI: Thursday, 13:30. The housing price index dropped to 0.2% in November, shy of the forecast of 0.2%. The estimate for December stands at 0.3%.
- Employment Charge: Friday, 13:30. This indicator is one of the most important economic releases and should be treated as a market-mover. In December, the economy added 53.7 thousand jobs, crushing the forecast of -5.1 thousand. Will we see another strong reading in January? The unemployment rate ticked up to 6.9% percent in January, matching the forecast.
* All times are GMT
USD/CAD Technical Analysis
USD/CAD opened the week at 1.3129 and quickly touched a high of 1.3169. The pair then reversed directions and dropped to a low of 1.2965, as 1.2908 held firm (discussed last week). USD/CAD closed the week at 1.3021.
Live chart of USD/CAD:
Technical lines, from top to bottom
1.3433 was the high point in October.
1.3351 is next.
1.3219 has some breathing room following losses by USD/CAD.
1.3124 has switched to a resistance role.
1.3003 is protecting the symbolic 1.30 level. It is a weak support level.
1.2908 has held in support since September 2016.
1.2763 is next.
1.2653 has provided support since June 2016. It is the final support line for now.
I am neutral on USD/CAD
The US economy remains headed in the right direction, and inflation levels have moved higher. This could lead to higher interest rates in the first half of 2017. However, there is uneasiness in the markets about Donald Trump, whose economic stance remains unclear.
Our latest podcast is titled Worrying wages and shining gold
Follow us on Sticher or iTunes
Safe trading!
Further reading:
- For EUR/USD, check out the Euro to Dollar forecast.
- For the Japanese yen, read the USD/JPY forecast.
- For GBP/USD (cable), look into the British Pound forecast.
- For the Australian dollar (Aussie), check out the AUD to USD forecast.
- For the kiwi, see the NZDUSD forecast.
