The Canadian dollar recorded strong gains for a second straight week, as USD/CAD dropped 110 points. The pair closed at 1.2860, its lowest weekly close since June 2016. This week’s key event is the BoC Rate Statement. Here is an outlook on the major market-movers and an updated technical analysis for USD/CAD.
Canadian employment data sparkled for a second straight week, as the economy added 45.3 thousand jobs, well above expectations. As well, the unemployment rate edged lower to 6.5%, down from 6.6%. In the US, the Federal Reserve minutes didn’t do much to raise investor confidence, unlike the upbeat rate statement in June. The minutes indicated that policymakers were divided over the timing of starting to reduce the Fed’s balance sheet, and members also expressed concerns about low inflation. US Nonfarm Payrolls rebounded in June, easily beating expectations.
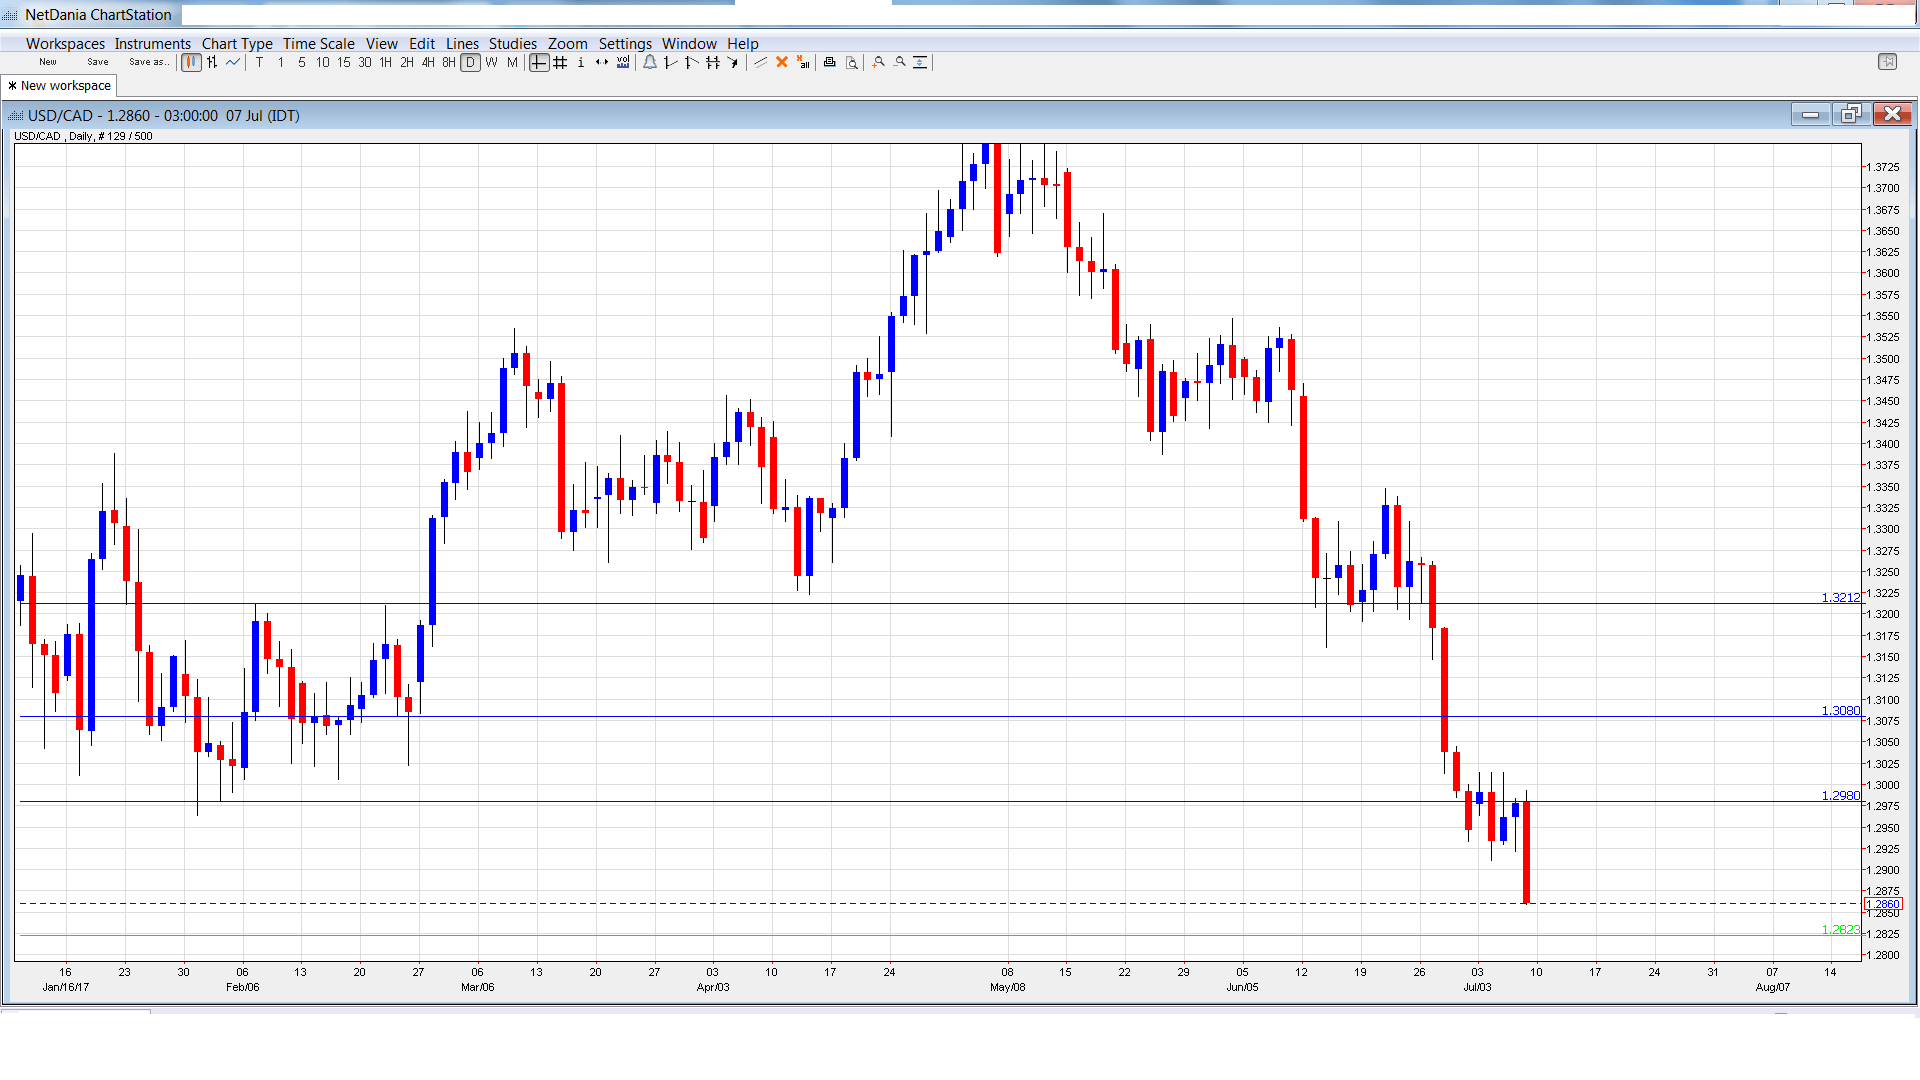
[do action=”autoupdate” tag=”USDCADUpdate”/]USD/CAD daily graph with support and resistance lines on it. Click to enlarge:
- Housing Starts: Tuesday, 12:15. The indicator provides a snapshot of the strength of the housing sector. In June, the indicator dipped below the 200 thousand level, coming in at 195 thousand. This was short of the forecast of 205 thousand and marked a 6-month low.
- BoC Monetary Policy Report: Wednesday, 14:00. This quarterly release details the bank’s view of economic conditions and inflation, and can provide clues regarding future monetary policy. It will be followed by a BoC press conference.
- BoC Rate Statement: Wednesday, 14:00. The BoC is expected to raise rates a quarter-point to 0.75%. This would be the first rate hike since July 2015 and could boost the Canadian dollar.
- NHPI: Thursday, 12:30. The housing inflation index improved to 0.8% in May, its strongest gain since 2007. The estimate for June stands at 0.2%.
USD/CAD Technical Analysis
USD/CAD opened the week at 1.2976 and quickly climbed to a high of 1.3014, testing resistance at 1.2980 (discussed last week). The pair recorded sharp losses at the end of the week, falling to 1.2859. The pair closed the week at 1.2860.
Live chart of USD/CAD:
Technical lines, from top to bottom
With USD/CAD posting sharp losses last week, we start at lower levels:
1.3212 has been a resistance line since late June.
1.3083 is protecting the symbolic 1.30 line.
1.2980 is an immediate resistance line.
1.2823 has provided support since September 2016.
1.2710 was an important cap in April 2015.
1.2457 is the final support line for now.
I am bearish on USD/CAD
The BoC is expected to raise rates, which could give the loonie a boost. In the US, there are growing doubts as to whether the Fed will raise rates one more time this year.
Our latest podcast is titled Markets are finally moving – will it last?
Follow us on Sticher or iTunes
Safe trading!
Further reading:
- For EUR/USD, check out the Euro to Dollar forecast.
- For the Japanese yen, read the USD/JPY forecast.
- For GBP/USD (cable), look into the British Pound forecast.
- For the Australian dollar (Aussie), check out the AUD to USD forecast.
- For the kiwi, see the NZDUSD forecast.
