The Canadian dollar endured its worst week since May 2016, losing 250 points. USD/CAD closed the week at 1.3369. This week’s key events are Trade Employment and Employment Change. Here is an outlook on the major market- movers and an updated technical analysis for USD/CAD.
In the US, Donald’s speech disappointed the markets, but stronger market sentiment over a rate hike boosted the greenback. Hawkish comments from Dudley and then from Brainard have sharply raised expectations of a March hike. In Canada, the BoC maintained the benchmark rate at 0.50%. GDP edged lower to 0.3%, matching the forecast.
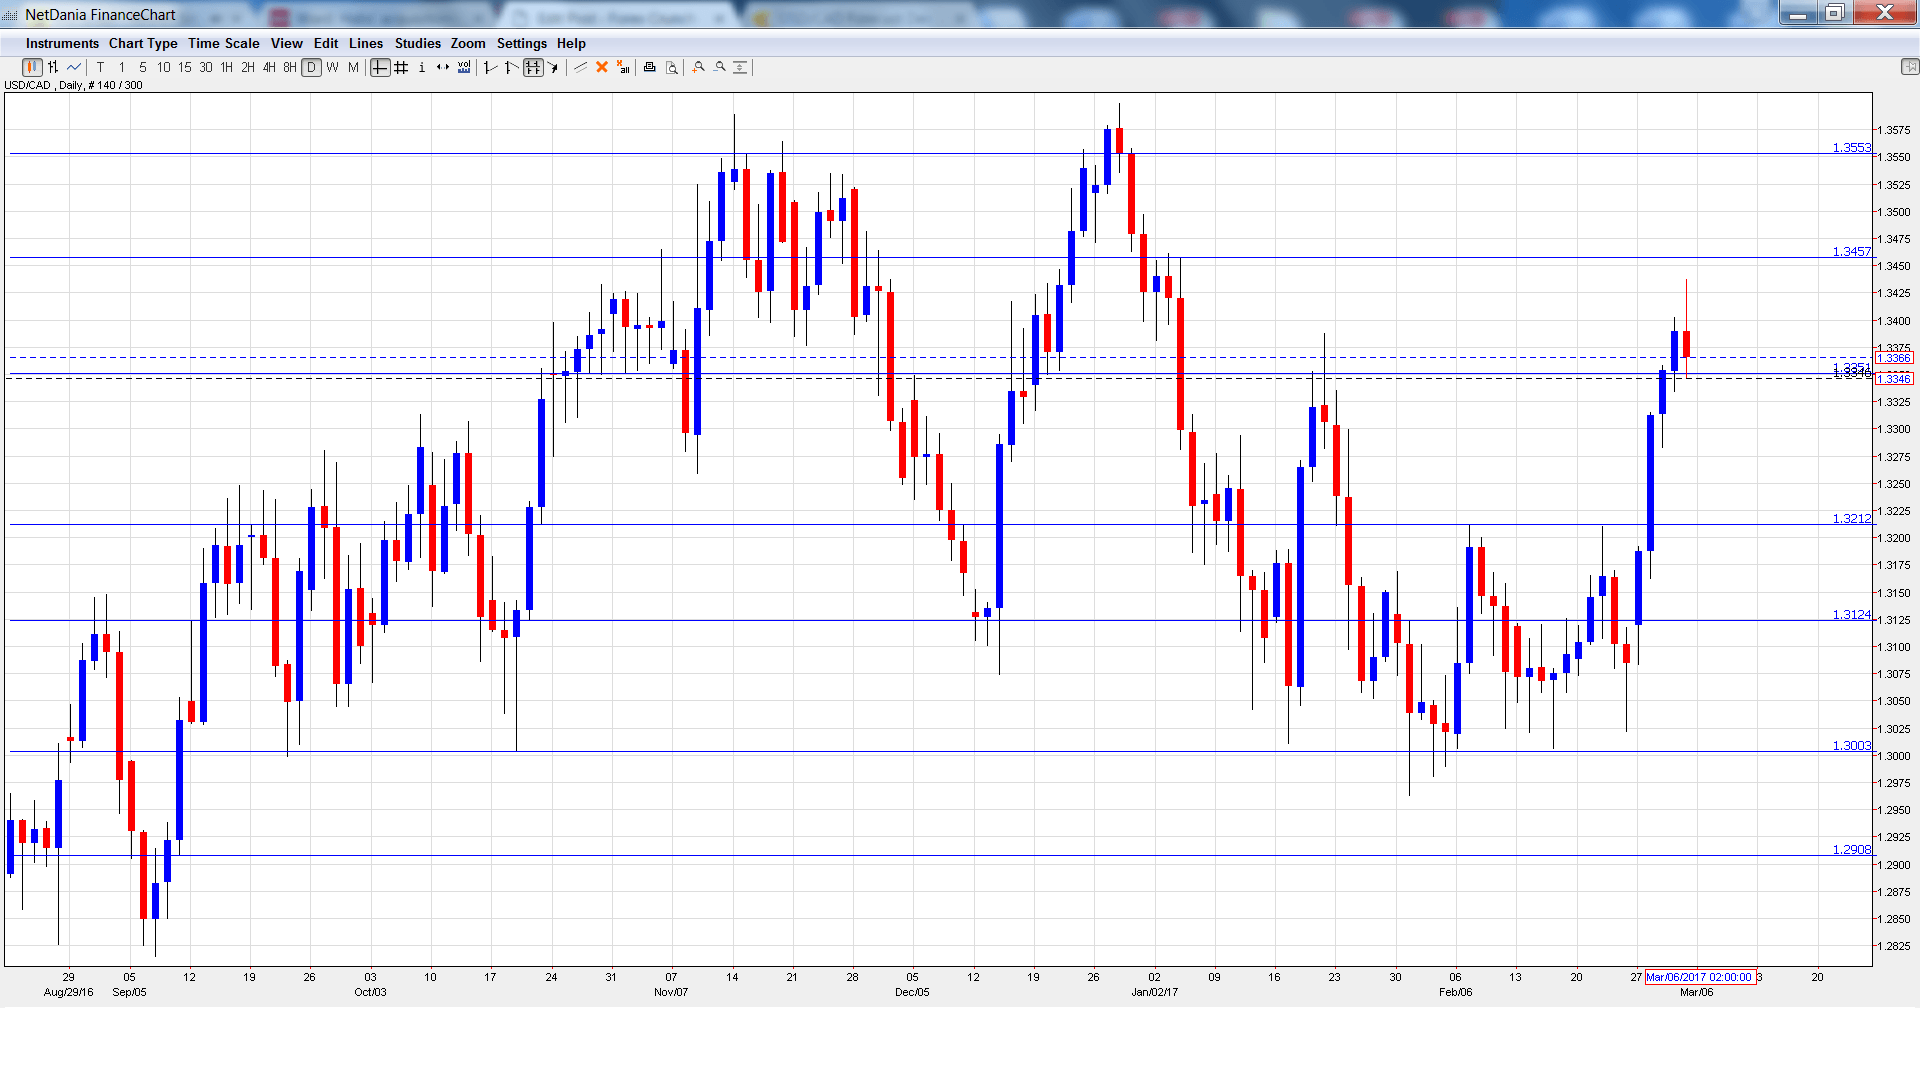
[do action=”autoupdate” tag=”USDCADUpdate”/]USD/CAD daily graph with support and resistance lines on it. Click to enlarge:
- Trade Balance: Tuesday, 13:30. After a string of trade deficits, Canada posted a second straight surplus in December. The surplus improved to C$0.9 billion, but fell short of the estimate of C$1.2 billion. The January surplus is expected to drop to C$0.2 billion.
- Ivey PMI: Tuesday, 15:00.The PMI dropped to 57.2 in January, short of the estimate of 58.3 points. The index is expected to widen to 58.9 in February.
- Housing Starts: Wednesday, 13:15. Housing Starts provides a snapshot of the level of activity in the housing market. The indicator has posted two straight readings of 207 thousand, beating expectations each time. The February estimate stands at 205 thousand.
- Building Permits: Wednesday, 13:30. Building Permits tends to show strong fluctuations, making accurate estimates a tricky task. In December, the indicator posted a sharp decline of 6.6%, weaker than the forecast of -3.5%.
- Labor Productivity: Wednesday, 13:30. The indicator rebounded in Q3 to 1.2%, edging above the estimate of 1.1%. Will we see another gain in Q4?
- NHPI: Thursday, 13:30. The housing inflation indicator dipped to 0.1% in January missing the estimate of 0.3%.
- Employment Change: Friday, 13:30. The economy added 48.3 thousand in January, crushing the forecast of -10.1 thousand. The unemployment rate edged lower to 6.8%, shy of the forecast of 6.9%.
* All times are GMT
USD/CAD Technical Analysis
USD/CAD opened the week at 1.3119 and quickly touched a low of 1.3083. The pair then reversed directions and climbed to a high of 1.3437 late in the week, testing resistance at 1.3433 (discussed last week). USD/CAD was unable to consolidate at this level and closed the week at 1.3369.
Live chart of USD/CAD:
Technical lines, from top to bottom
With USD/CAD soaring this week, we start at higher levels:
1.3782 was a cushion in early 2016.
1.3648 was an important support level in February.
1.3551 is the next line of resistance.
1.3457 was a high point in September 2015.
1.3351 has switched to a support role following sharp gains by USD/CAD. It is a weak line.
1.3212 was a cap in the second quarter of 2016.
1.3124 is the next support level.
1.3003 is protecting the symbolic 1.30 level.
1.2908 has held in support since September 2016. It is the final support level for now.
I am bullish on USD/CAD
The Trump administration’s first month in office has been beset by difficulties and still has not outlined an economic agenda. Still the US economy is doing well and growing optimism over a March rate hike is bullish for the US dollar.
Our latest podcast is titled March hike, Macron, and Mario Draghi
Follow us on Sticher or iTunes
Safe trading!
Further reading:
- For EUR/USD, check out the Euro to Dollar forecast.
- For the Japanese yen, read the USD/JPY forecast.
- For GBP/USD (cable), look into the British Pound forecast.
- For the Australian dollar (Aussie), check out the AUD to USD forecast.
- For the kiwi, see the NZDUSD forecast.
