USD/CAD showed some movement last week, but ended the week almost unchanged. The pair closed the week at 1.2977. This week’s highlights are the Overnight Rate and Employment Change. Here is an outlook on the major market-movers and an updated technical analysis for USD/CAD.
In the US, the nonfarm payrolls report was dismal, as the indicator plunged to 151 thousand, well short of the forecast of 180 thousand. Canadian GDP rebounded nicely, with a gain of 0.6% in June. This beat the forecast of 0.4%.
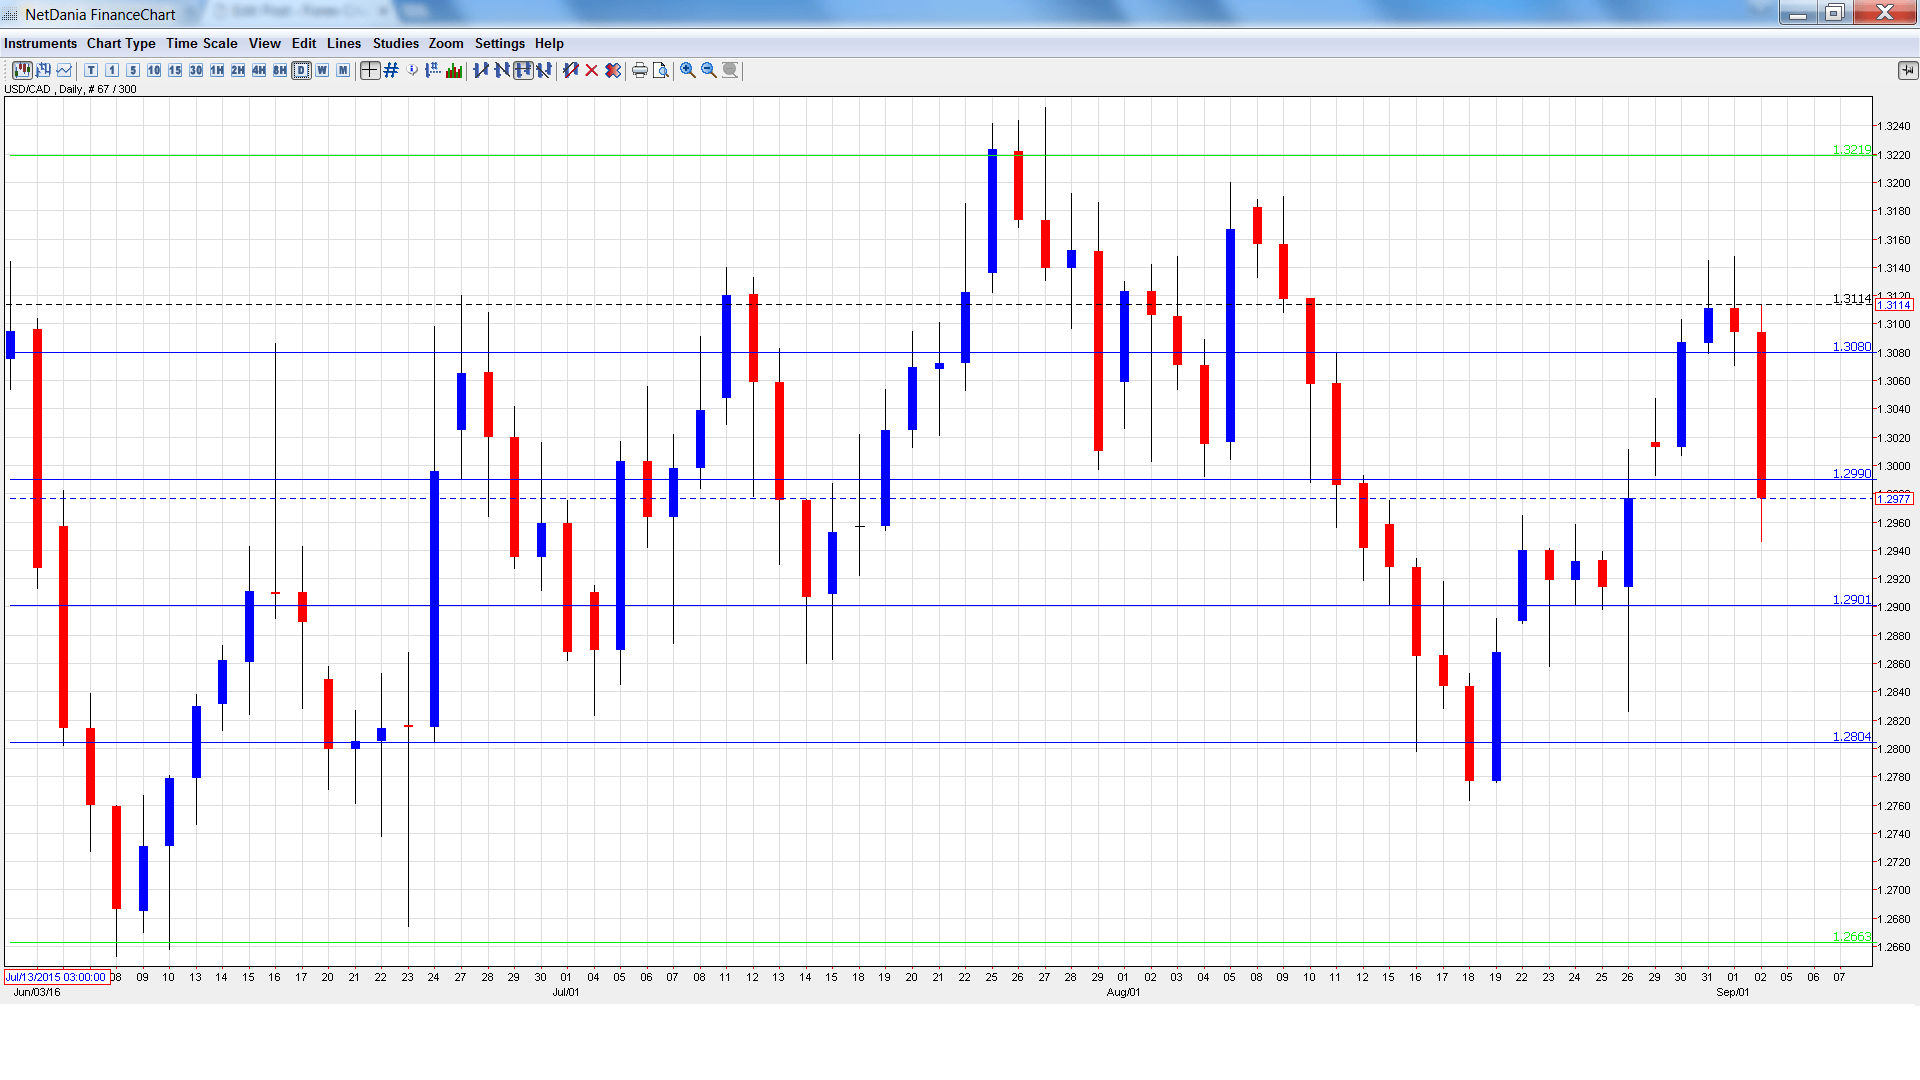
USD/CAD daily graph with support and resistance lines on it. Click to enlarge:
- BoC Overnight Rate: Wednesday, 14:00. The BoC is expected to maintain current rate levels, which have been pegged at 0.50% since May 2015.
- Ivey PMI: Wednesday, 14:00. The PMI jumped to 57.0 points in July, crushing the estimate of 51.9 points. Another strong gain is expected in the August report, with an estimate of 56.3 points.
- Building Permits: Thursday, 12:30. Building Permits continues to struggle, as the indicator has reeled off four straight declines. The June release was particularly weak, with a decline of 5.5%. This reading was much weaker than the forecast of +2.7%. The markets are expecting a turnaround in the July report, with an estimate of 2.1%.
- NHPI: Thursday, 12:30. This housing inflation indicator posted a weak gain of 0.1% in June, within expectations. The estimate for the July release stands at 0.2%.
- BOC Deputy Governor Timothy Lane Speaks: Thursday, 16:20. Lane will deliver remarks at an event in Thunder Bay. A speech which is more hawkish than expected is bullish for the Canadian dollar.
- Housing Starts: Friday, 12:15. This indicator provides a snapshot of the level of activity in the housing sector. In July, housing starts slipped to 198 thousand, just above the forecast of 196 thousand. The downward trend is expected to continue, with an estimate of 194 thousand.
- Employment Change: Friday, 12:30. This key indicator should be treated as a market-mover. The indicator was dismal in July, posting a decline of 31.2 thousand. This was much worse than the forecast of a gain of 10.2 thousand. Will the indicator improve in August? The unemployment rate edged up to 6.9% in July, matching the forecast.
USD/CAD opened the week at 1.3016. Late in the week, the pair climbed to a high of 1.3148 and then sharply reversed directions, dropping to a low of 1.2946, as support held at 1.2900 (discussed last week). The pair closed the week at 1.2977.
Live chart of USD/CAD:
Technical lines, from top to bottom
We begin with resistance at 1.3353.
1.3219 was a cap in April.
1.3081 is next.
1.2990 continues to be busy. Currently it is a weak resistance line.
1.2900 was tested in support for a second straight week.
1.2804 was an important cushion after the Brexit vote in late June.
1.2663 is next.
1.2562 was a cap in July 2015.
1.2459 is the final support line for now.
I am bullish on USD/CAD
With renewed hope that the Fed will raise interest rates before the end of the year, market sentiment is bullish on the US dollar. As well, the US economy is in better shape than its northern neighbor.
Our latest podcast is titled Ready your rate radar
Follow us on Sticher or iTunes
Further reading:
- For a broad view of all the week’s major events worldwide, read the USD outlook.
- For EUR/USD, check out the Euro to Dollar forecast.
- For the Japanese yen, read the USD/JPY forecast.
- For GBP/USD (cable), look into the British Pound forecast.
- For the Australian dollar (Aussie), check out the AUD to USD forecast.
- For the kiwi, see the NZDUSD forecast.
