USD/JPY reversed directions last week and dropped 80 points. The pair closed the week at 111.33. This week’s key events are the Tankan Manufacturing Indices. Here is an outlook for the highlights of this week and an updated technical analysis for USD/JPY.
In the US, CB Consumer Confidence improved sharply in March. In Japan, consumer spending and inflation numbers disappointed, as Household Spending and Tokyo CPI both missed their estimates.
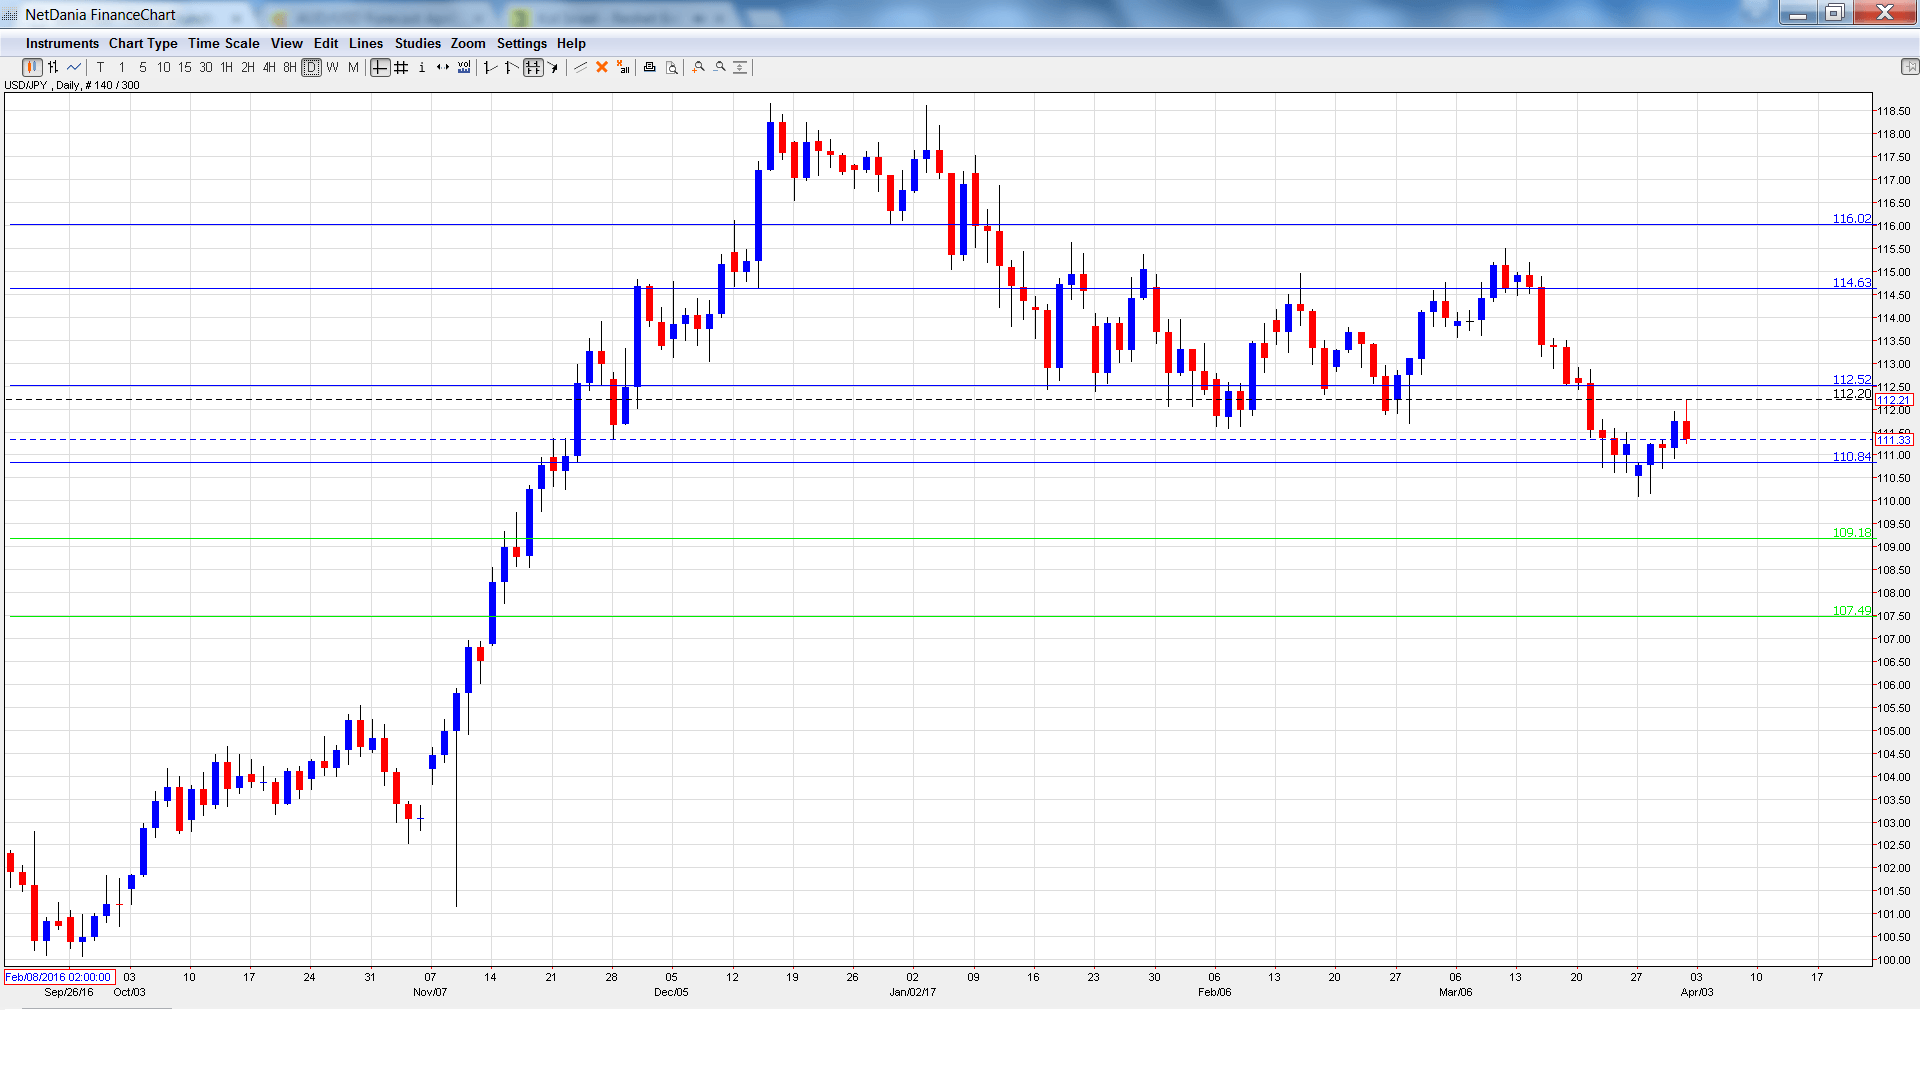
[do action=”autoupdate” tag=”USDJPYUpdate”/]USD/JPY graph with support and resistance lines on it. Click to enlarge:
- Tankan Manufacturing Index: Sunday, 23:50. The indicator improved to 10 points in Q4, up from 6 points in the previous quarter. The upward swing is expected to continue in the first quarter, with an estimate of 14 points.
- Tankan Non-Manufacturing Index: Tuesday, 23:50. This indicator was unchanged in the fourth quarter, with a reading of 18 points. Little change is expected in Q1, with a forecast of 19 points.
- Final Manufacturing PMI: Monday, 00:30. This manufacturing indicator has edged higher for three straight readings and continues to point to slight expansion. The index is expected to dip to 52.6 in the February report.
- Monetary Base: Monday, 23:50. Monetary Base has dropped three straight readings and fell to 21.4% in January, short of the forecast of 23.2%. The indicator is expected to reverse directions in February and climb to 23.2%.
- 10-y Bond Auction: Tuesday, 3:45. The yield remains negligible on 10-year bonds, with a yield of 0.08% in the March auction. No major movement is expected in the April release.
- BoJ Core CPI: Tuesday, 5:00. This inflation indicator excludes the most volatile items which are included in other consumer inflation indicators. The index is expected in at 0.2%, unchanged from the previous month.
- Consumer Confidence: Thursday, 5:00. The indicator continues to show readings well below the 50-level, pointing to continuing pessimism from the Japanese consumer. The indicator is expected to improve to 43.5 points in February.
- Average Cash Earnings: Friday, 00:00. This indicator is linked to consumer spending, a key component of economic growth. The indicator posted a gain of 0.5% in January and the estimate for February is also 0.5%.
- Leading Indicators: Tuesday, 5:00. In January, the indicator improved to 105.5%, and has improved for four straight readings. The markets are expecting a dip in February, with an estimate of 104.7%.
USD/JPY opened the week at 110.54 and quickly dropped to a low of 110.10. The pair climbed to a high of 112.20 late in the week, as resistance held firm at 112.53 (discussed last week). The pair couldn’t consolidate at this level and closed at 111.33.
Technical lines from top to bottom:
We start with resistance at 116.02.
114.63 was a cushion in December 2016 and January 2017.
112.53 is next.
110.83 remains busy and has switched to a resistance role.
109.18 is providing support. This line marked the start of a rally in September 2008 which saw USD/JPY drop close to the 0.87 level.
107.49 is the final support line for now.
I am neutral on USD/JPY
Trump’s troubles have raised concerns in the markets and the Fed remains dovish regarding future rates. Still. the US economy continues to look sharp, buoyed by a red-hot labor market.
Our latest podcast is titled Brexit Bad and “Clean Coal”
Follow us on Sticher or iTunes
Safe trading!
Further reading:
- For a broad view of all the week’s major events worldwide, read the USD outlook.
- For EUR/USD, check out the Euro to Dollar forecast.
- For the Japanese yen, read the USD/JPY forecast.
- For GBP/USD (cable), look into the British Pound forecast.
- For the Canadian dollar (loonie), check out the Canadian dollar forecast.
- For the kiwi, see the NZD/USD forecast.
