The Japanese yen posted its strongest gains since February, as USD/JPY plunged 430 points. The pair closed the week just below the 102 level. There are seven events on this week’s schedule. Here is an outlook for the highlights of this week and an updated technical analysis for USD/JPY.
The yen posted strong gains following the BoJ decision, in which the bank refrained from lowering rates or expanding its asset-purchase program. USD/JPY lost more ground after the soft GDP report, with the economy expanding just 1.2%, compared to the forecast of 2.6%.
do action=”autoupdate” tag=”USDJPYUpdate”/]
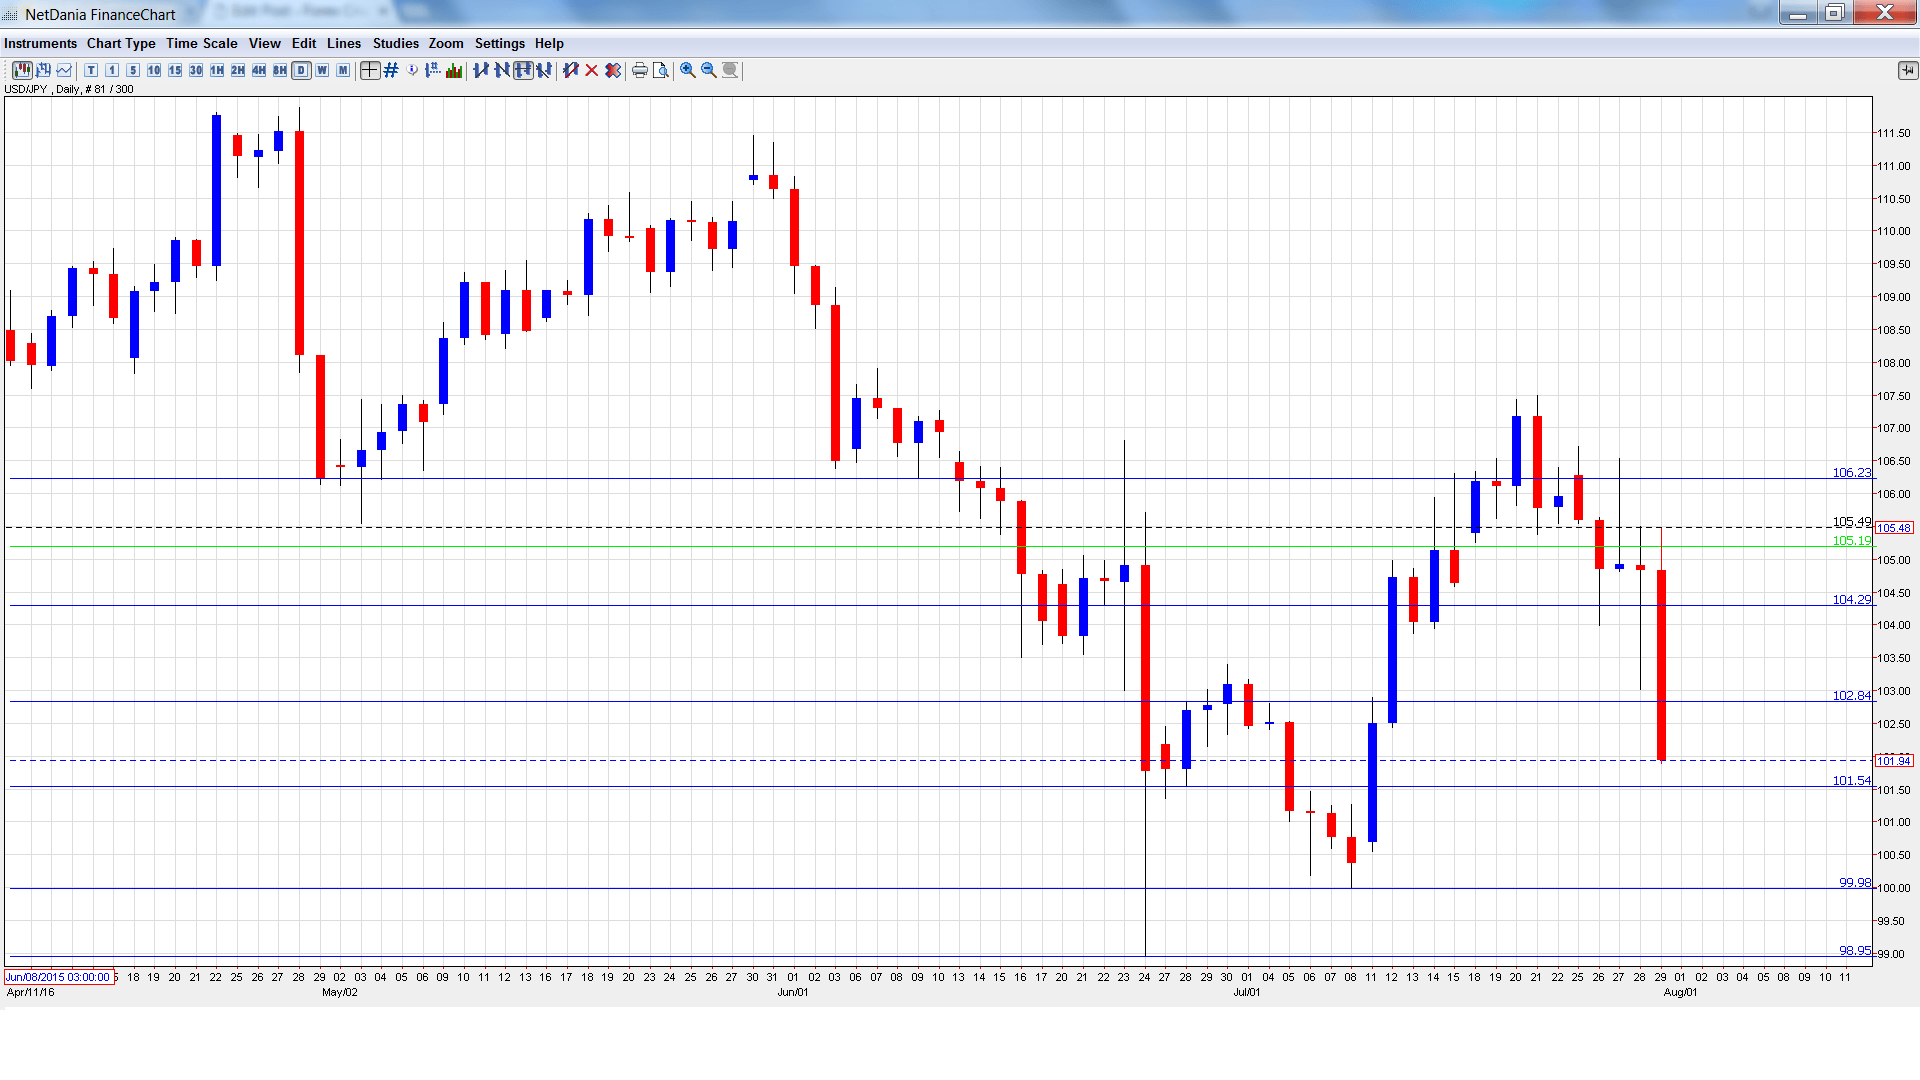
USD/JPY graph with support and resistance lines on it. Click to enlarge:
- Final Manufacturing PMI: Monday, 2:00. The PMI has recorded four straight readings below the 50-point line, pointing to contraction in the manufacturing sector. The June reading came in at 48.1 points, within expectations. The estimate for the July reading stands at 49.0 points.
- Monetary Base: Monday, 23:50. The indicator showed little change in June, with a reading of 25.4%. This was short of the forecast of 26.3%. The markets are expecting a drop to 24.3% in the July release.
- 10-year Bond Auction: Tuesday, 3:45. 10-year bonds continue to post negative yields. In July, the yield came in at -0.24%, compared to -0.09% in the June auction.
- Consumer Confidence: Tuesday, 5:00. Japanese consumer confidence continues to point to strong pessimism. The indicator posted a weak reading of 41.8 points in June, above the forecast of 41.1 points. The estimate for the July release stands at 42.2 points.
- BoJ Monetary Policy Meeting Minutes: Tuesday, 23:50. Analysts will be combing through the BoJ minutes, looking for clues regarding future monetary moves by the Bank.
- Average Cash Earnings: Friday, 00:00. The indicator disappointed in May, posting a decline of 0.2% ,well below expectations. This was the first decline since June 2015. The markets are expecting a turnaround in the June report, with an estimate of 0.4%.
- Leading Indicators: Friday, 00:00. The indicator dipped to 100.00% in the May reading, very close to the forecast. Little change is expected in the June release.
* All times are GMT
USD/JPY Technical Analysis
USD/JPY opened the week at 105.39 and touched a high of 106.72. The pair then reversed directions and dropped to a low of 101.89, as support held firm at 101.51 (discussed last week). The pair closed the week at 101.94.
Live chart of USD/JPY: [do action=”tradingviews” pair=”USDJPY” interval=”60″/]
Technical lines from top to bottom:
With USD/JPY posting sharp losses, we begin at lower levels:
106.25 is a strong resistance line.
105.19 was a cushion in October 2014.
104.25 is next.
102.80 is an immediate resistance line.
101.51 is providing weak support.
99.98 is next.
98.95 has held in support since late June.
97.61 was last tested in November 2013. It is the final support level for now.
I remain bearish on USD/JPY
The BoJ has shown yet again it has little monetary ammunition to bolster the struggling economy. At the same time, the Fed hasn’t provided any clues about a rate hike, so September could come and go without a rate hike.
Our latest podcast is titled A grounded chopper, slow-mo growth, and an unreliable BOE boyfriend?
Follow us on Sticher or on iTunes
Further reading:
- For a broad view of all the week’s major events worldwide, read the USD outlook.
- For EUR/USD, check out the Euro to Dollar forecast.
- For the Japanese yen, read the USD/JPY forecast.
- For GBP/USD (cable), look into the British Pound forecast.
- For the Canadian dollar (loonie), check out the Canadian dollar forecast.
- For the kiwi, see the NZD/USD forecast
