USD/JPY continued to rally last week, climbing 215 points. USD/JPY closed the week at 117.57. This week’s highlight is the BoJ interest rate release. Here is an outlook for the highlights of this week and an updated technical analysis for USD/JPY.
The US dollar continued to post broad gains, buoyed by the Federal Reserve’s quarter point rate hike to 0.50%. This was just the second rate hike since the financial crisis in 2008. The Fed was hawkish in its rate statement and upgraded its hike forecast for 2017. This triggered a US dollar rally and the yen suffered another rough week. Elsewhere, US retail sales missed expectations, while US CPI came in at 0.2%, matching the forecast. In Japan, the Tankan indices were strong and met expectations.
do action=”autoupdate” tag=”USDJPYUpdate”/]
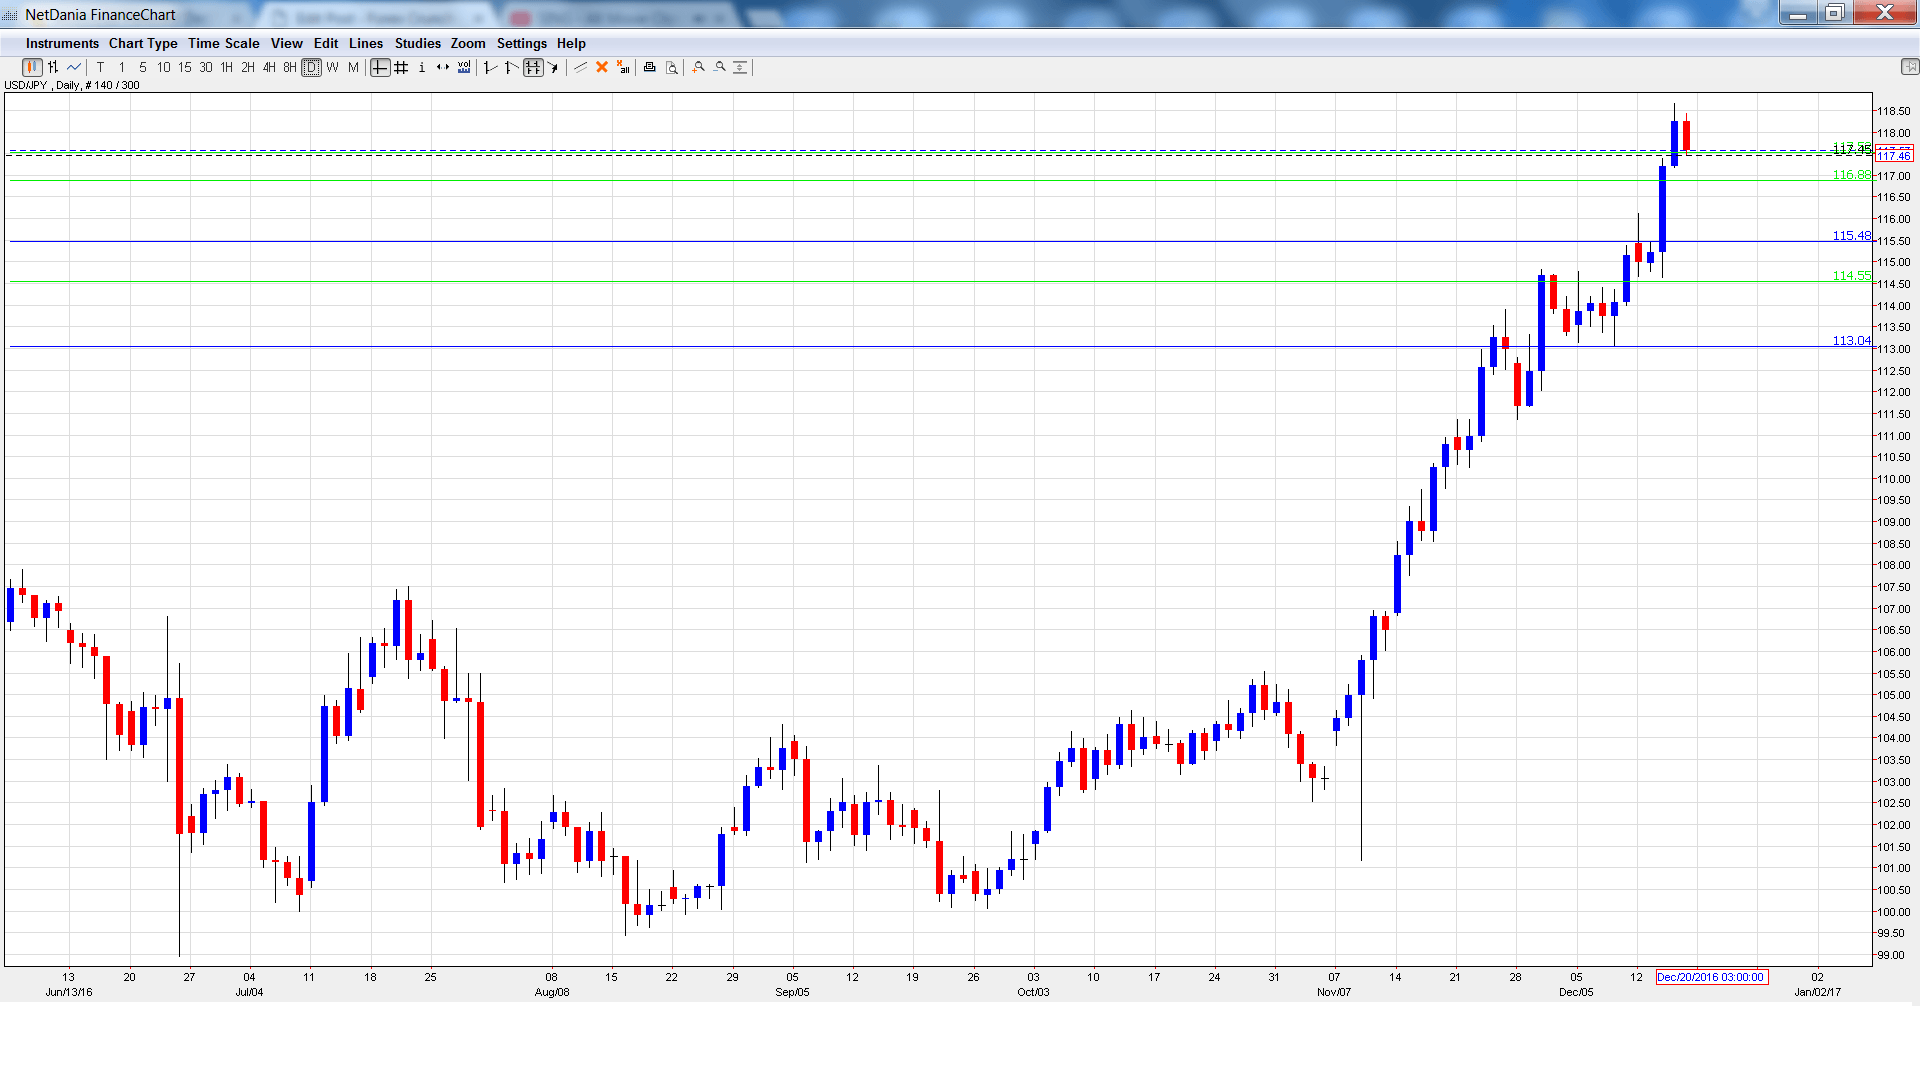
USD/JPY graph with support and resistance lines on it. Click to enlarge:
- Trade Balance: Sunday, 23:50. Japan’s trade surplus improved to 0.47 trillion yen in October, above the forecast of 0.41 trillion. The upward movement is expected to continue, with an estimate of 0.57 trillion.
- BoJ Policy Rate: Tuesday, Tentative. The BoJ cut rates to -0.10% back in January and has remained on the sidelines ever since. The bank is expected to maintain current rate levels at this week’s policy meeting. Analysts will be combing through the policy statement – if the BoJ conveys a hawkish message, the yen could gain ground. A press conference will follow the release of the rate statement.
- All Industries Activity: Wednesday, 4:50. This minor release has been steady, posting two straight gains of 0.2%. The indicator is expected to edge lower to 0.1% in October.
* All times are GMT
USD/JPY Technical Analysis
USD/JPY opened the week at 115.42 and dropped to a low of 114.63. The pair then reversed directions and climbed to a high of 118.66, as resistance held firm at 118.79 (discussed last week). USD/JPY closed the week at 117.57.
Live chart of USD/JPY:
Technical lines from top to bottom:
With USD/JPY continuing to post strong gains, we start at higher levels:
121.44 is a strong resistance line.
120.25 is protecting the symbolic 120 level.
118.79 held firm in resistance. This line was last breached in February.
117.52 has switched to support after strong gains by USD/JPY.
116.88 was a cap in February 2015.
115.48 is next.
114.55 marked a high point in March.
113.04 is the final support level for now.
I remain bullish on USD/JPY
The US dollar is flying high and could make further headway in the aftermath of the Fed rate hike. Economic sentiment remains high ahead of Donald Trump taking over in Washington, which could be bullish for the greenback.
Our latest podcast is titled The FED and the Road Ahead
Follow us on Sticher or iTunes
Further reading:
- For a broad view of all the week’s major events worldwide, read the USD outlook.
- For EUR/USD, check out the Euro to Dollar forecast.
- For the Japanese yen, read the USD/JPY forecast.
- For GBP/USD (cable), look into the British Pound forecast.
- For the Canadian dollar (loonie), check out the Canadian dollar forecast.
- For the kiwi, see the NZD/USD forecast.
