USD/JPY continued to post gains last week, climbing 160 points. USD/JPY closed the week at 115.15. This week’s highlights are the Tankan indices. Here is an outlook for the highlights of this week and an updated technical analysis for USD/JPY.
In the US, key economic indicators continue to impress. ISM Non-Manufacturing PMI beat expectations and UoM Consumer Sentiment climbed and easily beat the estimate. In Japan, Current Account exceeded the forecast, while Final GDP came in 0.3%, short of the estimate of 0.6%.
do action=”autoupdate” tag=”USDJPYUpdate”/]
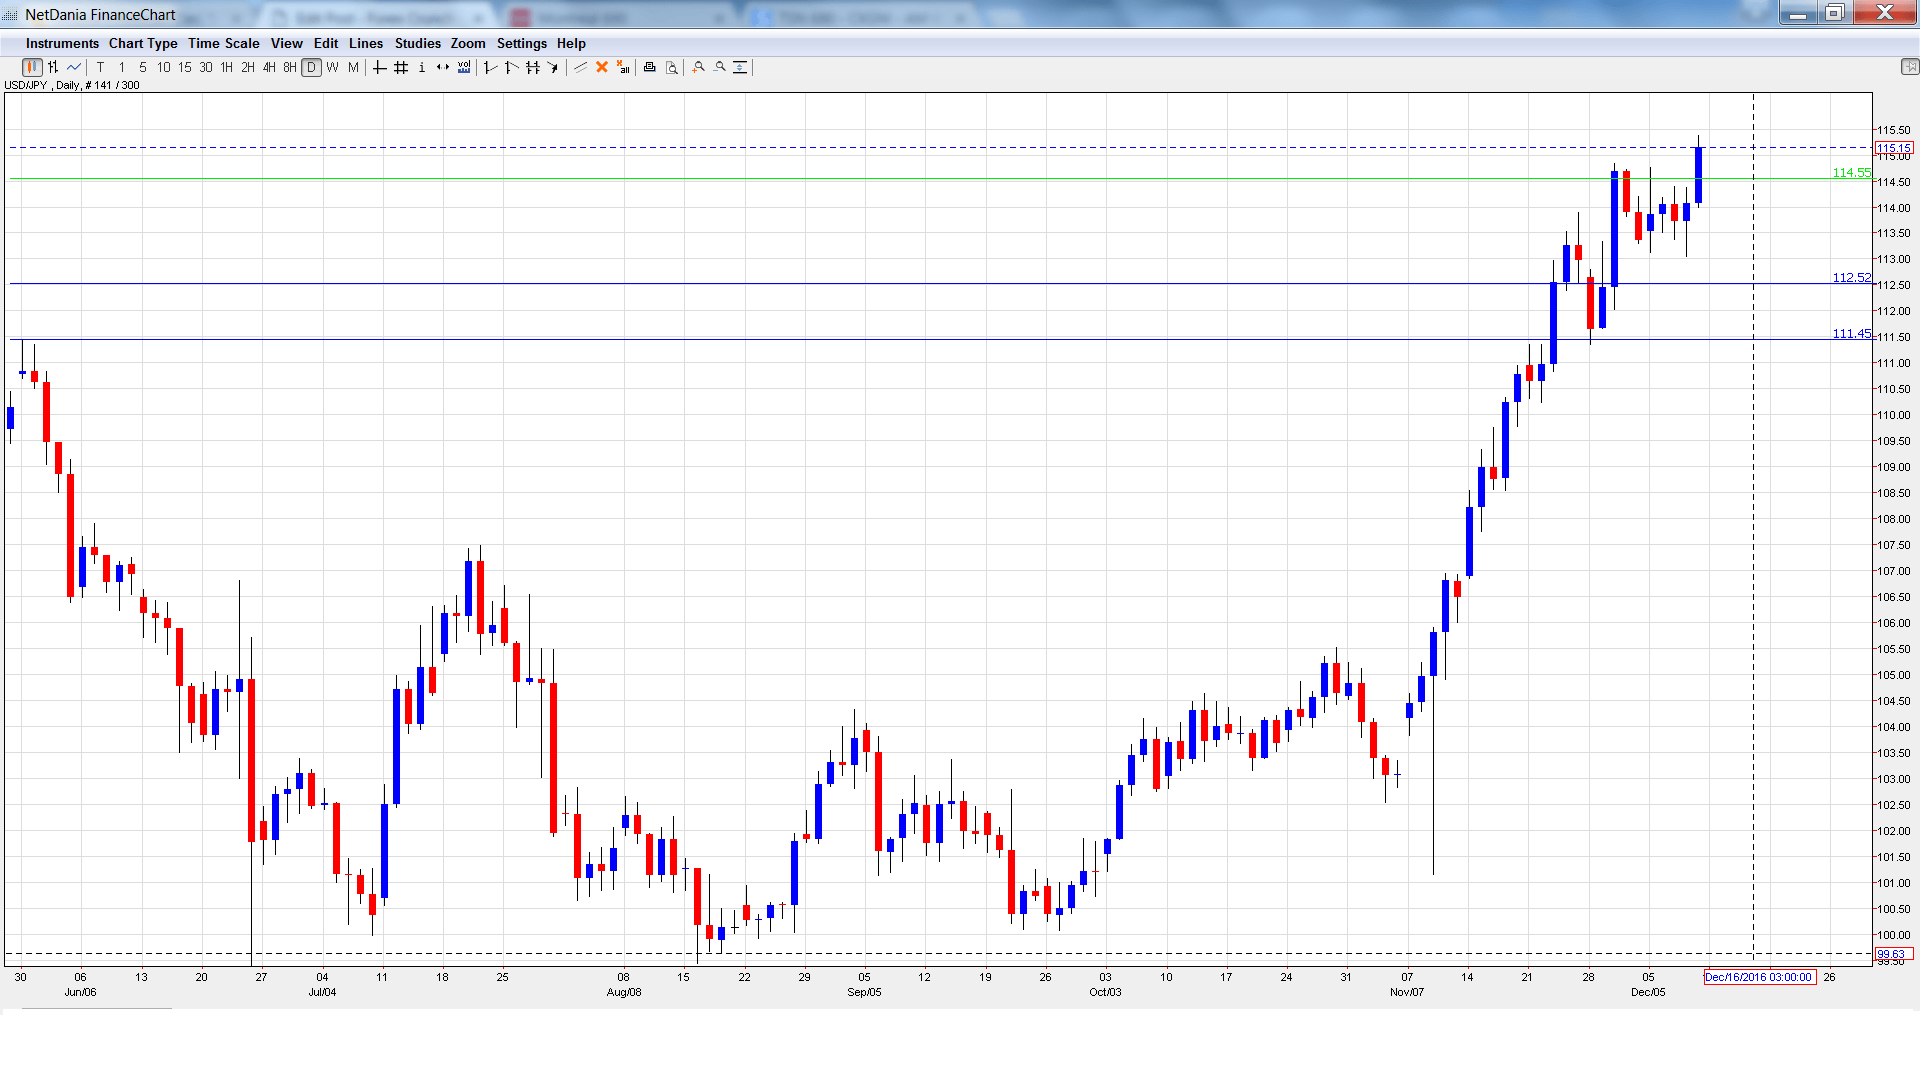
USD/JPY graph with support and resistance lines on it. Click to enlarge:
- Core Machinery Orders: Sunday, 23:50. The indicator came in at -3.3% in September, marking a second straight decline. This was much weaker than the estimate of -1.8%. The markets are expecting a turnaround in October, with an estimate of 1.3%.
- Tertiary Industry Activity: Monday, 4:30. The indicator declined 0.1% in September, edging above the forecast of -0.2%. The markets are expecting better news in the October report, with an estimate of 0.3%.
- Tankan Manufacturing Index: Tuesday, 23:50. The index has been steady, posting three straight readings of 6 points. The estimate for Q3 stands at 10 points.
- Tankan Non-Manufacturing Index: Tuesday, 23:50. The index remains strong but has been moving downwards. The indicator edged lower to 18 points in the second quarter. Little change is expected in the Q3 report.
- Revised Industrial Production: Wednesday, 4:30. This indicator dipped to 0.6% in September, easily beating the estimate of 0.0%. The markets are expecting a weak October report of 0.1%.
- Flash Manufacturing PMI: Thursday, 00:30. The PMI came in at 51.1 points in November, pointing to stagnation in the manufacturing sector. The estimate for the December report stands at 51.5 points.
* All times are GMT
USD/JPY Technical Analysis
USD/JPY opened the week at 113.52 and dropped to a low of 113.04 late in the week. The pair then sharply reversed directions and climbed to 115.37, as resistance held firm at 115.56 (discussed last week). USD/JPY closed the week at 115.15.
Live chart of USD/JPY:
Technical lines from top to bottom:
We start with resistance at 118.79.
117.52 has held in resistance since February.
116.88 was a cap in February 2015.
115.56 was a cushion in December 2014.
114.55 marked a high point in March.
113.23 is next.
112.53 was a cap in April 2016.
111.45 is the final support line for now.
I remain bullish on USD/JPY
The Fed will likely raise rates this week for the first time since December, so the greenback could get a boost. The Japanese economy continues to struggle, so the yen could be in for a rough ride.
Our latest podcast is titled From the Crude Cut to Draghi’s Drag
Follow us on Sticher or iTunes
Further reading:
- For a broad view of all the week’s major events worldwide, read the USD outlook.
- For EUR/USD, check out the Euro to Dollar forecast.
- For the Japanese yen, read the USD/JPY forecast.
- For GBP/USD (cable), look into the British Pound forecast.
- For the Canadian dollar (loonie), check out the Canadian dollar forecast.
- For the kiwi, see the NZD/USD forecast.
