The Japanese yen posted gains for a second straight week, as USD/JPY closed just above the 112 level. This week’s key event is Household Spending. Here is an outlook for the highlights of this week and an updated technical analysis for USD/JPY.
US numbers were respectable last week. The FOMC’s minutes were slightly dovish but still upbeat. Still, the dollar failed to gain ground as the the Trump administration is yet to outline its economic agenda. In Japan, corporate inflation edged up to 0.5%, within expectations.
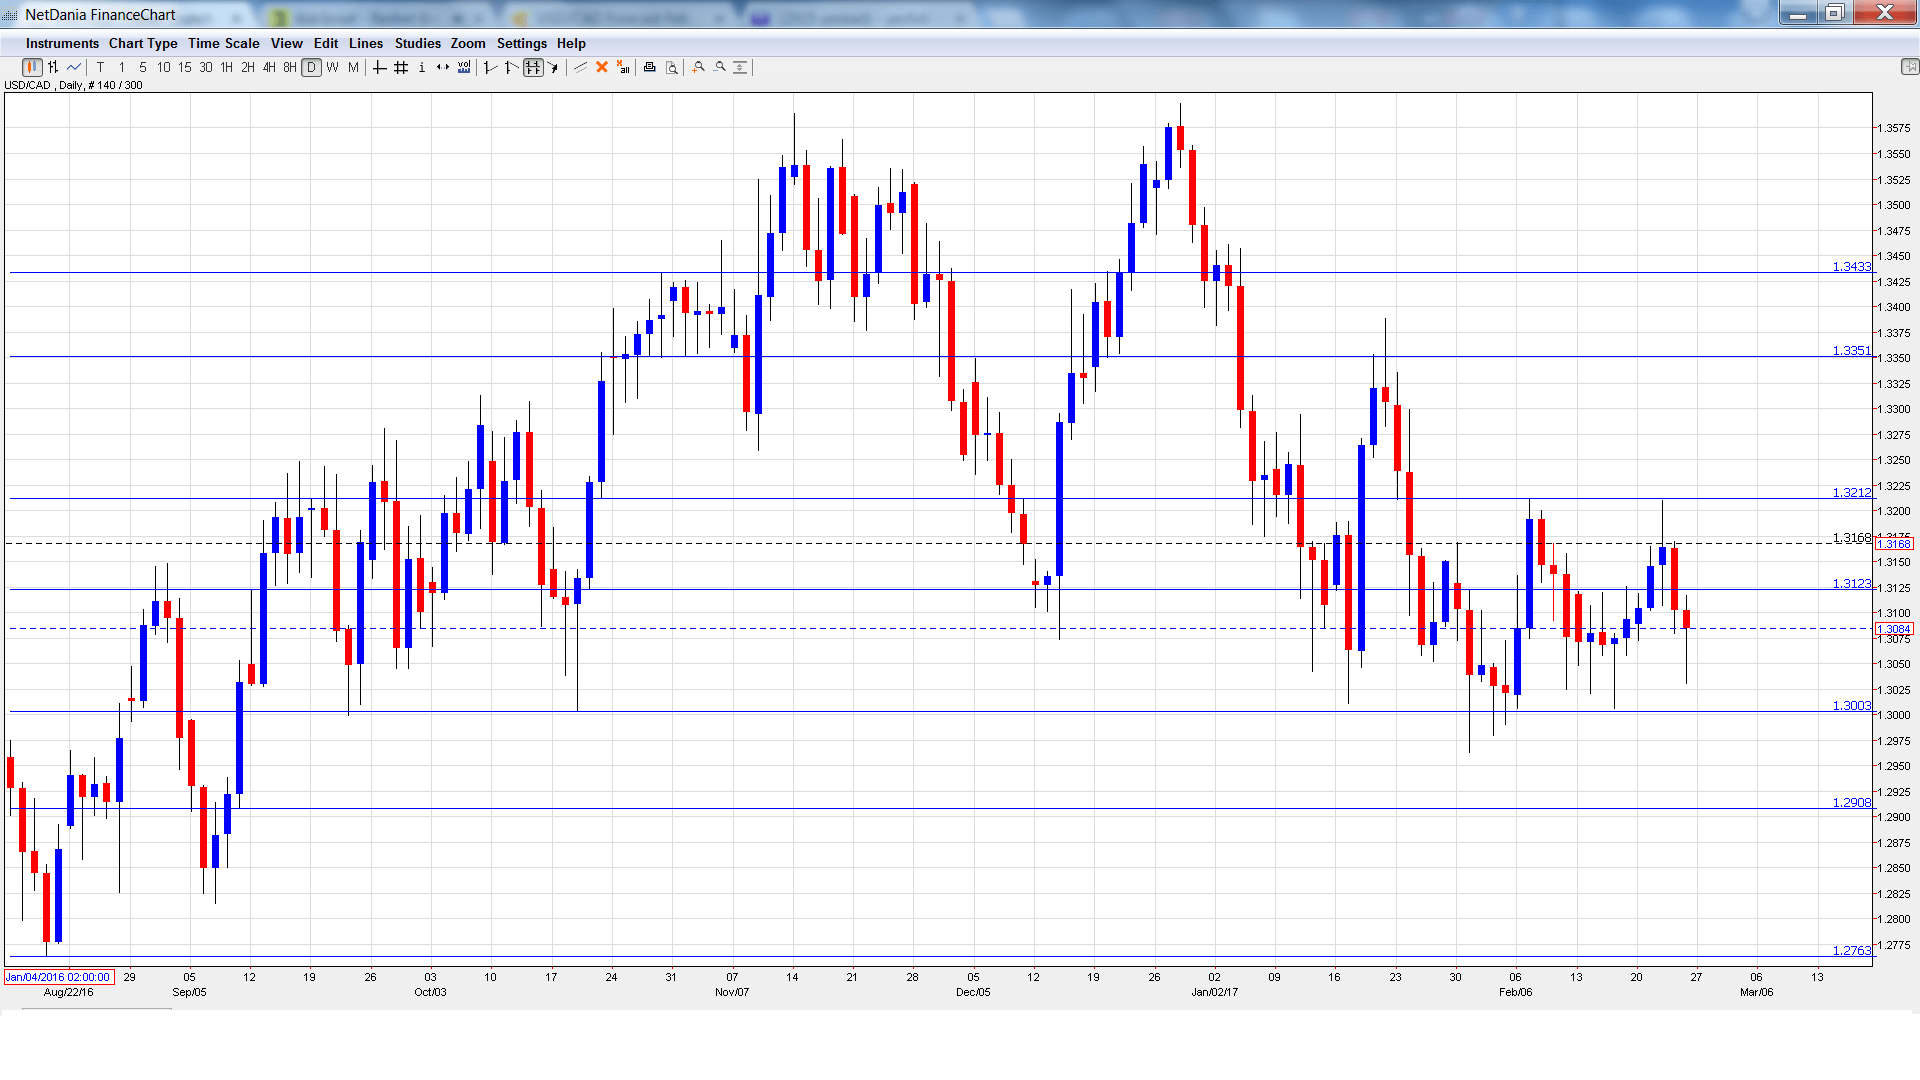
[do action=”autoupdate” tag=”USDJPYUpdate”/]USD/JPY graph with support and resistance lines on it. Click to enlarge:
- Preliminary Industrial Production: Monday, 23:50. The indicator dropped to 0.5% in December, just above the forecast of 0.4%. The estimate for the January report remains at 0.4%.
- Housing Starts: Tuesday, 5:00. The indicator tends to show strong fluctuation. In December, the indicator dropped to 3.9%, well below the estimate of 8.5%. The downward trend is expected to continue, with an estimate of 3.4%.
- Capital Spending: Tuesday, 23:50. This indicator is an important gauge of the level of activity in the business sector. In Q3, the indicator declined 1.3%, worst than the estimate of -0.4%. The markets are expecting a strong turnaround in Q4, with a forecast of +0.6%.
- Final Manufacturing PMI: Wednesday, 00:30. This manufacturing index continues to indicate slight expansion. In January, the index edged up to 52.7, very close to the forecast of 52.8 points. The upward swing is expected to continue in February, with a forecast of 53.6.
- Monetary Base: Wednesday, 23:50. The indicator dipped to 22.6% in January, short of the estimate of 24.2%. The estimate for February stands at 23.2%.
- 10-y Bond Auction: Thursday, 3:45. The yield on 10-year bonds ticked up to 0.09% in February, a third straight rise. Will the upward swing continue?
- HousehoId Spending: Thursday, 23:30. This important consumer indicator continues to post declines. In December, the indicator posted a decline of 0.3%, beating the estimate of -0.8%. The forecast for the January report stands at -0.3%.
- Consumer Spending: Friday, 5:00. The indicator continues to post readings below the 50-level, pointing to ongoing pessimism among consumers. The estimate for the February reading stands at 43.7 points.
USD/JPY opened the week at 112.91 and climbed to a high of 113.78, as resistance held at 113.80 (discussed last week). The pair then reversed directions and dropped to a low of 111.88. USD/JPY closed the week at 112.10.
Live chart of USD/JPY:
Technical lines from top to bottom:
We begin with resistance at 115.90.
114.55 marked a high point in March 2015.
113.80 is next.
112.53 was a cap in April 2016. It is a weak resistance line.
110.83 is next.
109.18 marked the start of a rally in September 2008 which saw USD/JPY drop close to the 0.87 level.
107.90 is the final support level for now.
I am bullish on USD/JPY
The markets remain concerned over Donald Trump, as his administration’s first month in office has been beset by crises and difficulties in filling key cabinet positions. Still the US economy is doing well and there is a strong likelihood of a rate hike in the first of 2017.
Our latest podcast is titled Fed refocus as monetary matters once again
Follow us on Sticher or iTunes
Safe trading!
Further reading:
- For a broad view of all the week’s major events worldwide, read the USD outlook.
- For EUR/USD, check out the Euro to Dollar forecast.
- For the Japanese yen, read the USD/JPY forecast.
- For GBP/USD (cable), look into the British Pound forecast.
- For the Canadian dollar (loonie), check out the Canadian dollar forecast.
- For the kiwi, see the NZD/USD forecast.

