USD/JPY dropped over 200 points last week, briefly breaking below the symbolic 100 level. The pair closed the week at 100.36. Here is an outlook for the highlights of this week and an updated technical analysis for USD/JPY. There are seven events this week.
The Brexit earthquake has bolstered the yen as jittery investors continue to flock to the safe-haven currency. In the US, the Fed minutes were cautious and a rate hike remains unlikely. US employment numbers were strong at the end of the week, but the strong yen held its own against the greenback.
do action=”autoupdate” tag=”USDJPYUpdate”/]
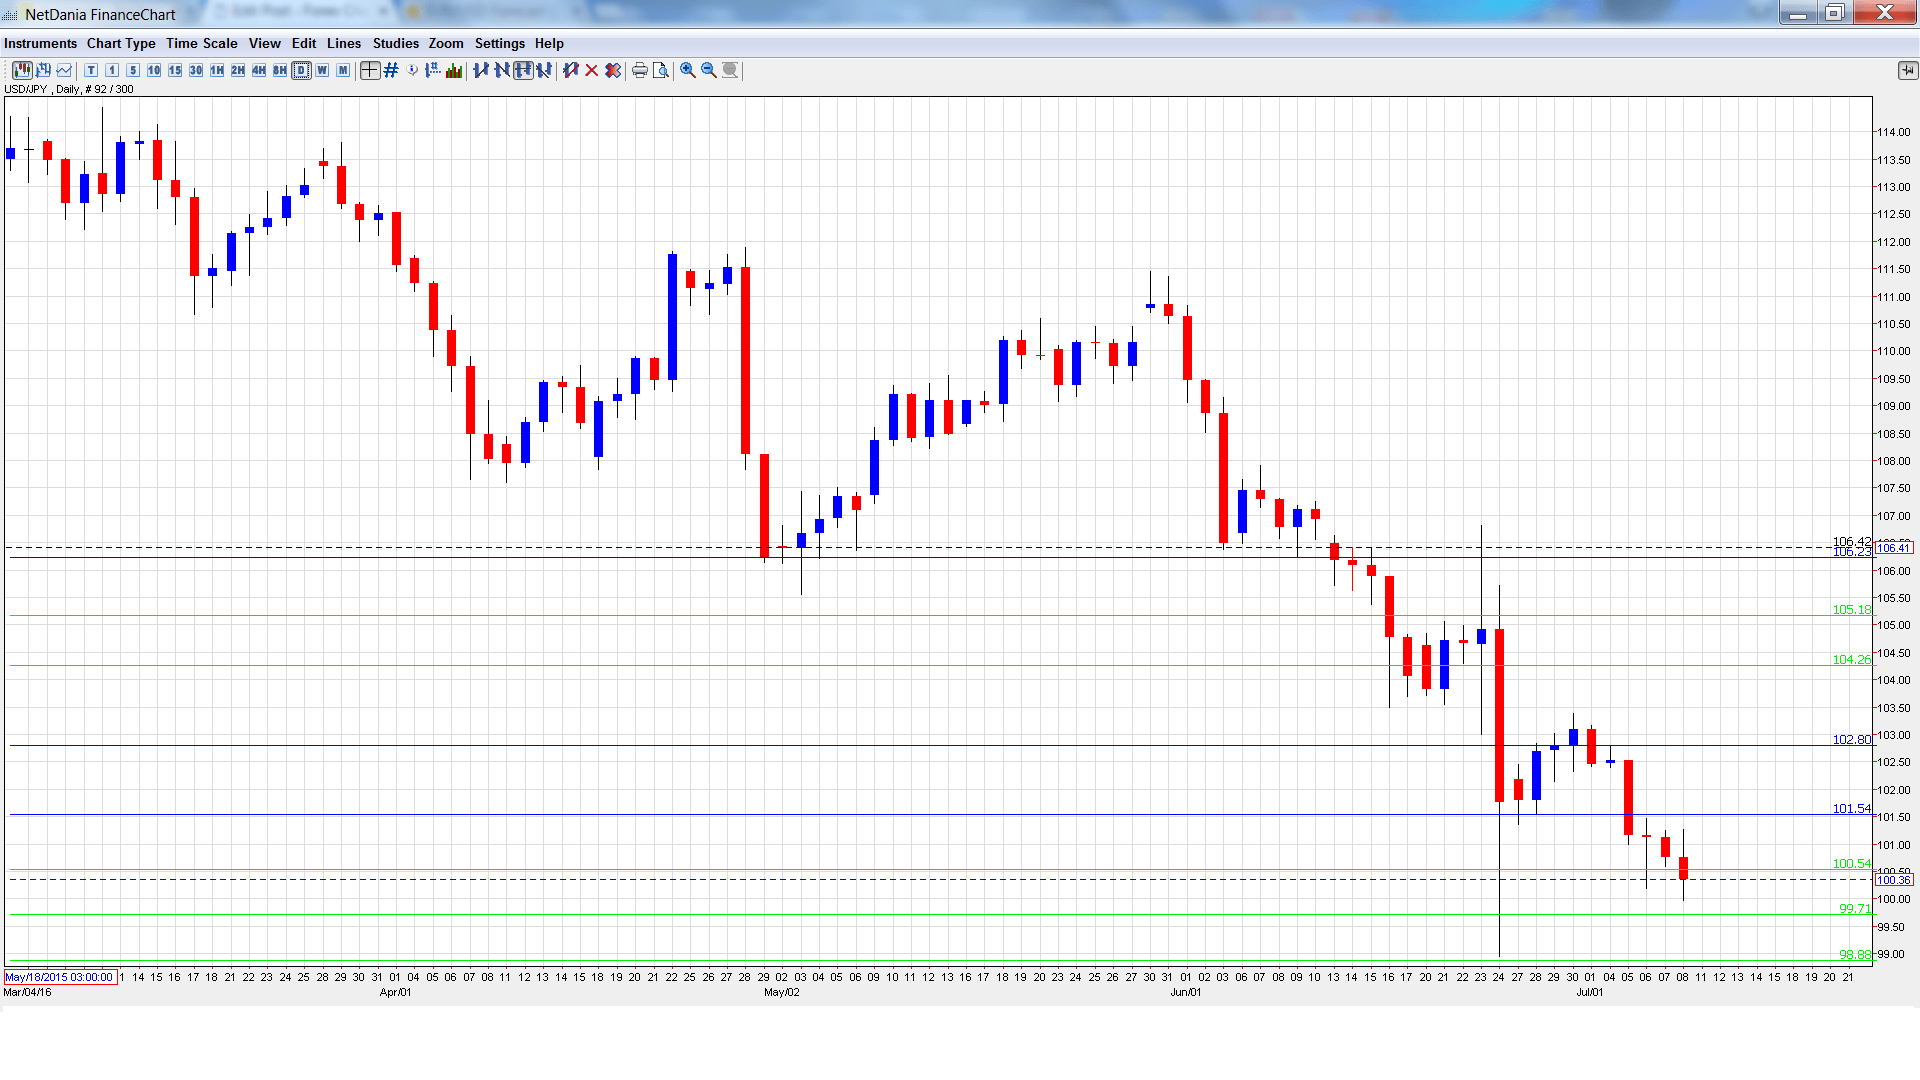
USD/JPY graph with support and resistance lines on it. Click to enlarge:
- Upper House Elections: Sunday, All Day. Japanese voters will go to the polls on Sunday. This election is being viewed as a referendum on Prime Minister Abe’s economic policy, so the yen could react to the election results.
- Core Machinery Orders: Sunday, 23:50. The indicator took a downward trend in April, with a decline of 11.0%. This was well below the forecast of -3.2%. The markets are expecting a strong improvement in the May, with an estimate of 2.8%.
- Preliminary Machine Tool Orders: Monday, 6:00. This manufacturing indicator continues to post declines, pointing to ongoing weak activity in the manufacturing sector. In May, the indicator came in at -24.7%, revised from -25.0%.
- PPI: Monday, 23:50. This indicator measures inflation in the manufacturing sector. PPI continues to point to deflation and has posted two straight readings of -4.2%. The estimate for the June report stands at -4.1%.
- 30-year Bond Auction: Tuesday, 3:45. Yields on 30-year bonds remains at low levels, with the June yield coming in at 0.31%. This was almost identical to the May auction.
- Tertiary Industry Activity: Tuesday, 4:30. This indicator provides a snapshot of activity in the business sector. In April, the indicator reversed directions and posted a strong gain of 1.4%, easily beating the forecast of 0.7%. However, the markets are braced for a decline of 0.7% in the May report.
- Revised Industrial Production: Wednesday, 4:30. The indicator posted a gain of 0.5% in April, within expectations. However, the indicator is expected to post a sharp decline of 2.2% in the May release.
* All times are GMT
USD/JPY Technical Analysis
USD/JPY opened the week at 102.48 and quickly touched a high of 102.80. The pair then reversed directions and dropped all the way to 99.98, as support held firm at 99.71 (discussed last week). The pair closed the week at 100.36.
Live chart of USD/JPY: [do action=”tradingviews” pair=”USDJPY” interval=”60″/]
Technical lines from top to bottom:
With USD/JPY posting sharp losses, we start at lower levels:
104.25 has strengthened in resistance following strong losses by USD/JPY.
102.80 was tested in resistance early in the week.
101.51 was a cushion in August 2014.
100.54 is a weak resistance line. It could see action early in the week.
99.71 held fast in support as USD/JPY briefly dropped below the 100 line.
98.88 is the next line of support.
97.78 has provided support since November 2013.
96.71 is the final support level for now.
I remain bearish on USD/JPY
The BoJ has no appetite to adopt further easing steps which would curb the yen’s strength. As well, Brexit jitters will likely continue to bolster the safe-haven yen.
Our latest podcast is titled 3 markets – 3 totally different Brexit reactions
Follow us on Sticher or on iTunes
Further reading:
- For a broad view of all the week’s major events worldwide, read the USD outlook.
- For EUR/USD, check out the Euro to Dollar forecast.
- For the Japanese yen, read the USD/JPY forecast.
- For GBP/USD (cable), look into the British Pound forecast.
- For the Canadian dollar (loonie), check out the Canadian dollar forecast.
- For the kiwi, see the NZD/USD forecast
